Tutorial
This tutorial walks through a minimal end-to-end OrthoSNAP run using the bundled example dataset.
1. Download test data
Download the tutorial dataset:
Unpack and move into the dataset directory:
$ tar -zxvf dataset.tar.gz
$ cd path_to_unzipped_directory/dataset
2. Run OrthoSNAP
Run OrthoSNAP with required arguments:
$ orthosnap -f fake_orthologous_group_of_genes.faa -t fake_orthologous_group_of_genes_tree.tre
To also generate a full-tree subgroup visualization:
$ orthosnap -f fake_orthologous_group_of_genes.faa -t fake_orthologous_group_of_genes_tree.tre -ps
3. Inspect output
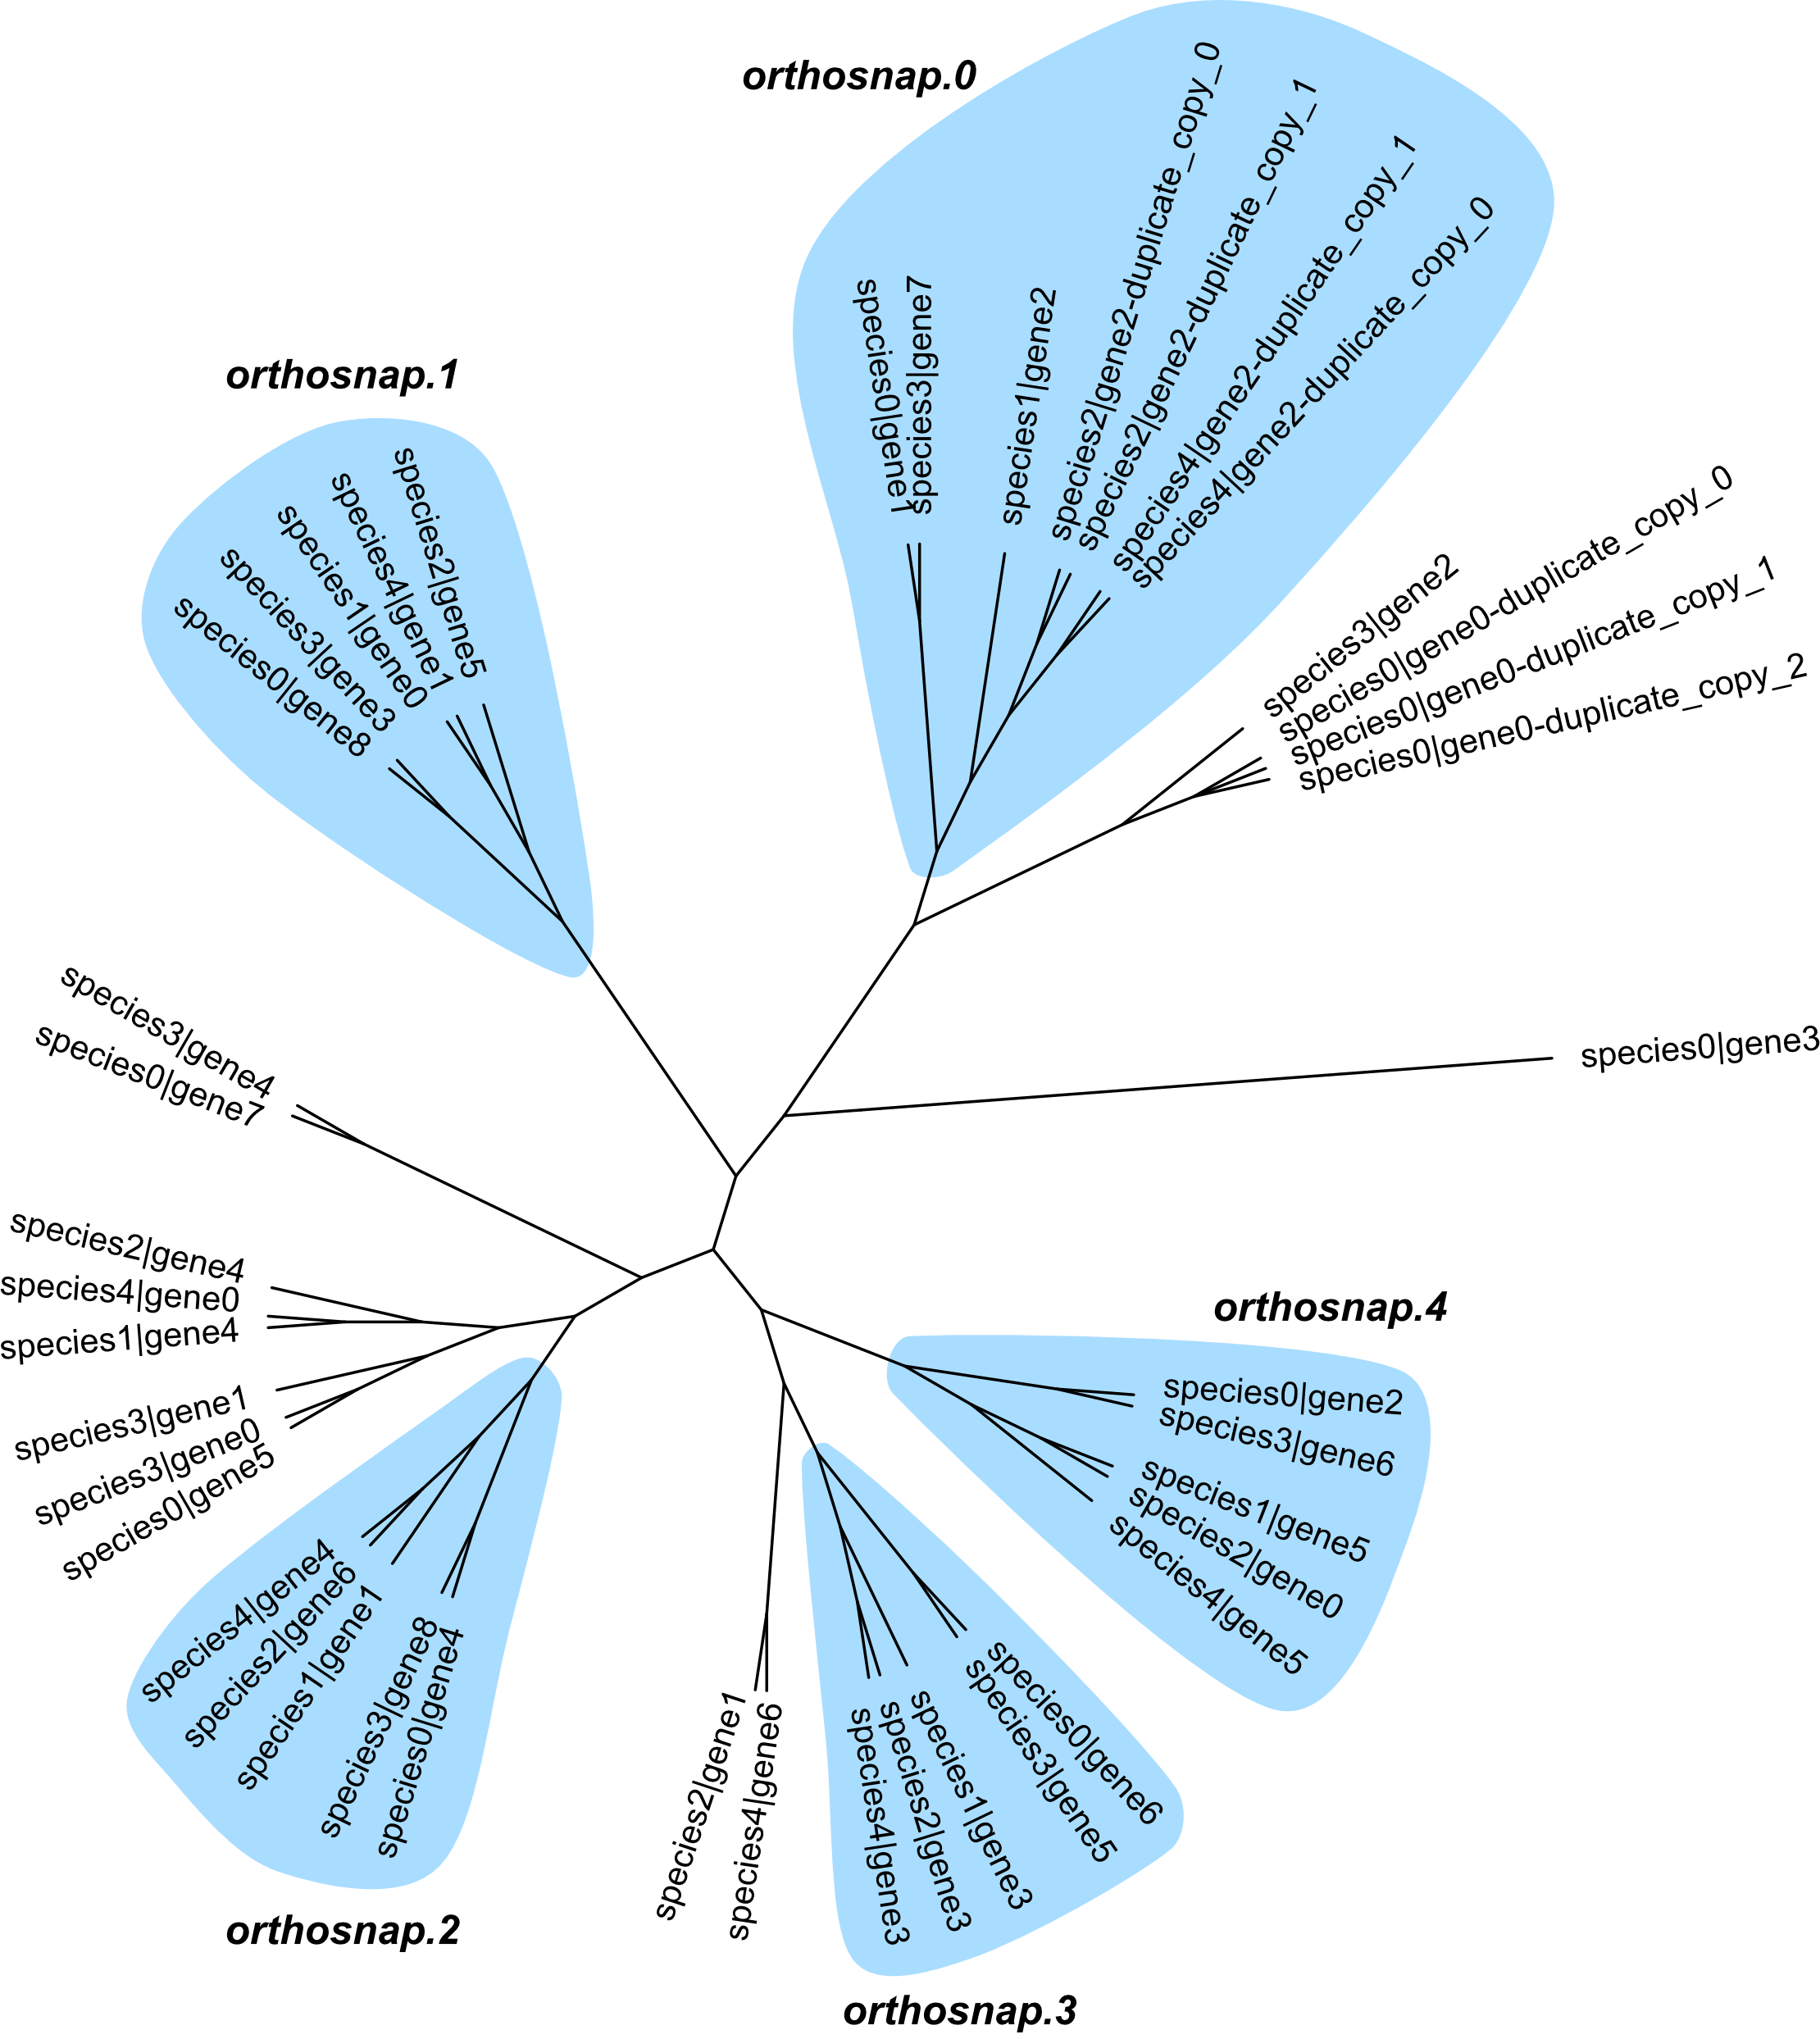
Near the end of stdout, you should see output similar to:
Subgroups of single-copy orthologous genes identified: 5
Output files:
   fake_orthologous_group_of_genes.faa.orthosnap.0.fa
   fake_orthologous_group_of_genes.faa.orthosnap.1.fa
   fake_orthologous_group_of_genes.faa.orthosnap.2.fa
   fake_orthologous_group_of_genes.faa.orthosnap.3.fa
   fake_orthologous_group_of_genes.faa.orthosnap.4.fa
This indicates five SNAP-OG FASTA files were produced.
If -ps is used, an additional plot file is produced:
fake_orthologous_group_of_genes.faa.orthosnap.subgroups.png
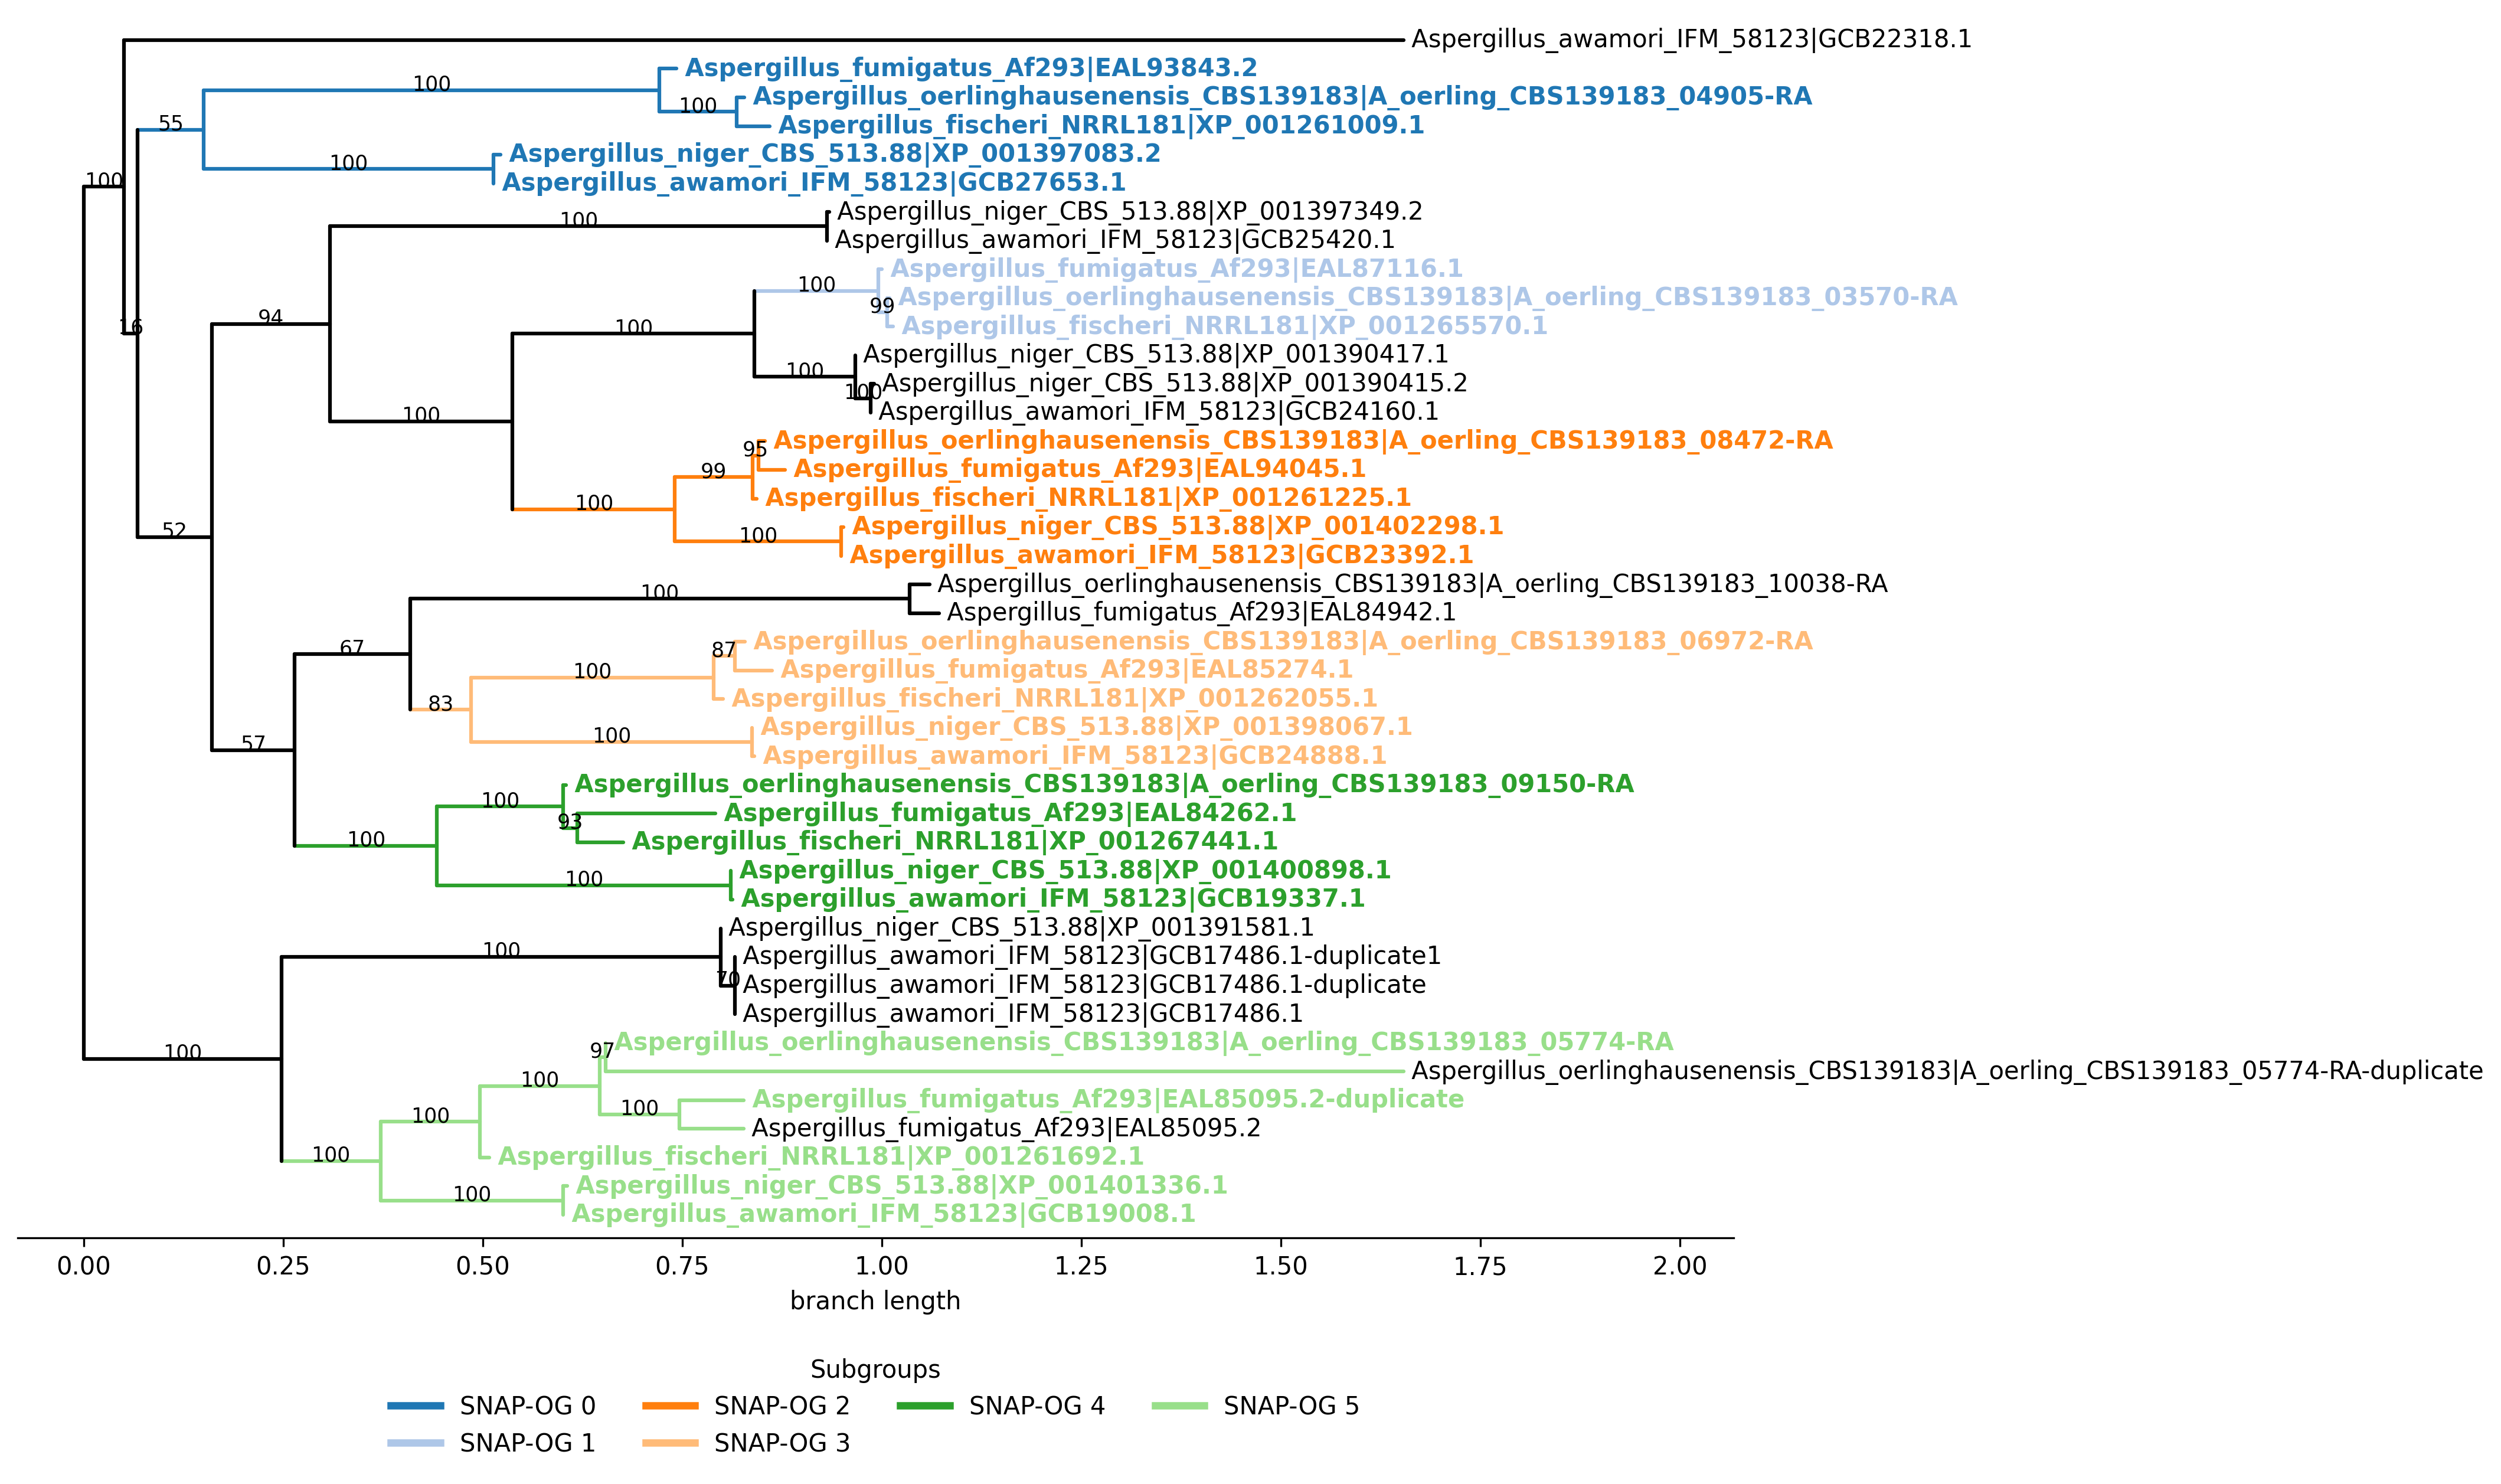
Interpretation
In this example, some species have duplicate copies. OrthoSNAP evaluates subtree structure, prunes species-specific inparalogs according to the selected -ip/–inparalog_to_keep rule, and outputs subgroups that satisfy single-copy criteria.
By default, longest_seq_len is used, matching common transcriptomics workflows where the longest isoform is often retained.