Usage
This section covers practical OrthoSNAP usage. For a full worked example, see the tutorial.
OrthoSNAP takes:
a gene tree in Newick format
the FASTA file used to infer that tree
It outputs one FASTA file per inferred SNAP-OG (single-copy orthologous subgroup). Optionally, it can also write a Newick tree per SNAP-OG, an inparalog handling report, and one color-coded subgroup plot for the full input tree.
Version differences
v1.6.0 expands OrthoSNAP from single-run CLI usage to pipeline-oriented workflows:
Batch manifests (
--manifest)Validation-only preflight checks (
--validate-only)Structured provenance output (
--structured-output)Explicit occupancy semantics (
--occupancy-count,--occupancy-fraction)Resume-aware execution (
--resume)Bootstrap consensus subgrouping (
--bootstrap-trees,--consensus-min-frequency,--consensus-trees)
Compared with prior versions:
v1.5.0: plotting outputs and performance improvements.
v1.3.2: delimiter configurability.
v1.2.0: inparalog handling report output.
v1.0.0 and earlier: core subgroup extraction/pruning behavior.
Basic usage
For most cases, only -f/–fasta and -t/–tree are required:
$ orthosnap -f orthogroup_of_genes.faa -t phylogeny_of_orthogroup_of_genes.tre
Validation-only preflight
Use --validate-only to check tree/FASTA concordance, delimiter consistency,
and duplicate labels without performing SNAP-OG extraction.
$ orthosnap -f orthogroup_of_genes.faa -t phylogeny_of_orthogroup_of_genes.tre --validate-only
Structured provenance outputs
Use --structured-output to emit machine-readable run metadata and subgroup summaries.
Generated files:
<input>.orthosnap.run.json(inputs, hashes, arguments, timing, status)<input>.orthosnap.subgroups.tsv(subgroup-level summary)
$ orthosnap -f orthogroup_of_genes.faa -t phylogeny_of_orthogroup_of_genes.tre --structured-output
Occupancy modes
OrthoSNAP supports three occupancy inputs:
-o/--occupancylegacy numeric threshold--occupancy-countexplicit count threshold--occupancy-fractionfraction in(0, 1]converted to a count per input FASTA
Use only one occupancy mode at a time.
$ orthosnap -f orthogroup_of_genes.faa -t phylogeny_of_orthogroup_of_genes.tre --occupancy-count 5
$ orthosnap -f orthogroup_of_genes.faa -t phylogeny_of_orthogroup_of_genes.tre --occupancy-fraction 0.5
Resume mode
Use --resume to skip rerunning jobs that already have completed outputs in the target directory.
$ orthosnap -f orthogroup_of_genes.faa -t phylogeny_of_orthogroup_of_genes.tre --resume
Batch manifest mode
Use --manifest with a TSV/CSV listing runs. Required columns are:
treefasta
Optional per-row columns can override CLI defaults (for example: support, occupancy,
occupancy_count, occupancy_fraction, delimiter, rooted, snap_trees,
report_inparalog_handling, inparalog_to_keep, output_path, id).
$ orthosnap --manifest runs.tsv --structured-output -op batch_results/
Manifest mode writes aggregate summaries:
manifest_summary_<timestamp>.tsvmanifest_summary_<timestamp>.json
Bootstrap consensus mode
Use --bootstrap-trees with a plain-text file containing one tree path per line.
OrthoSNAP extracts subgroup tip sets from each tree and reports consensus groups.
Use --consensus-min-frequency to require a minimum support frequency.
Use --consensus-trees to additionally write one consensus Newick tree per emitted group.
$ orthosnap -f orthogroup_of_genes.faa -t reference.treefile --bootstrap-trees bootstrap_paths.txt --consensus-min-frequency 0.5
$ orthosnap -f orthogroup_of_genes.faa -t reference.treefile --bootstrap-trees bootstrap_paths.txt --consensus-trees
Input requirements
FASTA headers and tree tip labels must match.
Taxon and sequence IDs must be separated by the same delimiter in both files.
Default delimiter is | (for example, species_A|gene_001).
Accounting for tree uncertainty
OrthoSNAP can collapse low-support bipartitions before pruning inparalogs.
Default support threshold is 80.
Use -s/–support to change it.
$ orthosnap -f orthogroup_of_genes.faa -t phylogeny_of_orthogroup_of_genes.tre -s 70
Choosing which inparalog to keep
Use -ip/–inparalog_to_keep to select how species-specific inparalogs are resolved.
Supported values:
shortest_seq_len
median_seq_len
longest_seq_len (default)
shortest_branch_len
median_branch_len
longest_branch_len
Examples:
$ orthosnap -f orthogroup_of_genes.faa -t phylogeny_of_orthogroup_of_genes.tre -ip shortest_branch_len
$ orthosnap -f orthogroup_of_genes.faa -t phylogeny_of_orthogroup_of_genes.tre -ip median_seq_len
Inparalog handling report
Use -rih/–report_inparalog_handling to write a tab-delimited report named <input_fasta>.inparalog_report.txt.
Columns are:
SNAP-OG identifier
kept inparalog
trimmed inparalog(s), separated by ;
$ orthosnap -f orthogroup_of_genes.faa -t phylogeny_of_orthogroup_of_genes.tre -rih
Specifying the delimiter
If your headers do not use |, specify the delimiter with -d/–delimiter.
$ orthosnap -f orthogroup_of_genes.faa -t phylogeny_of_orthogroup_of_genes.tre -d -
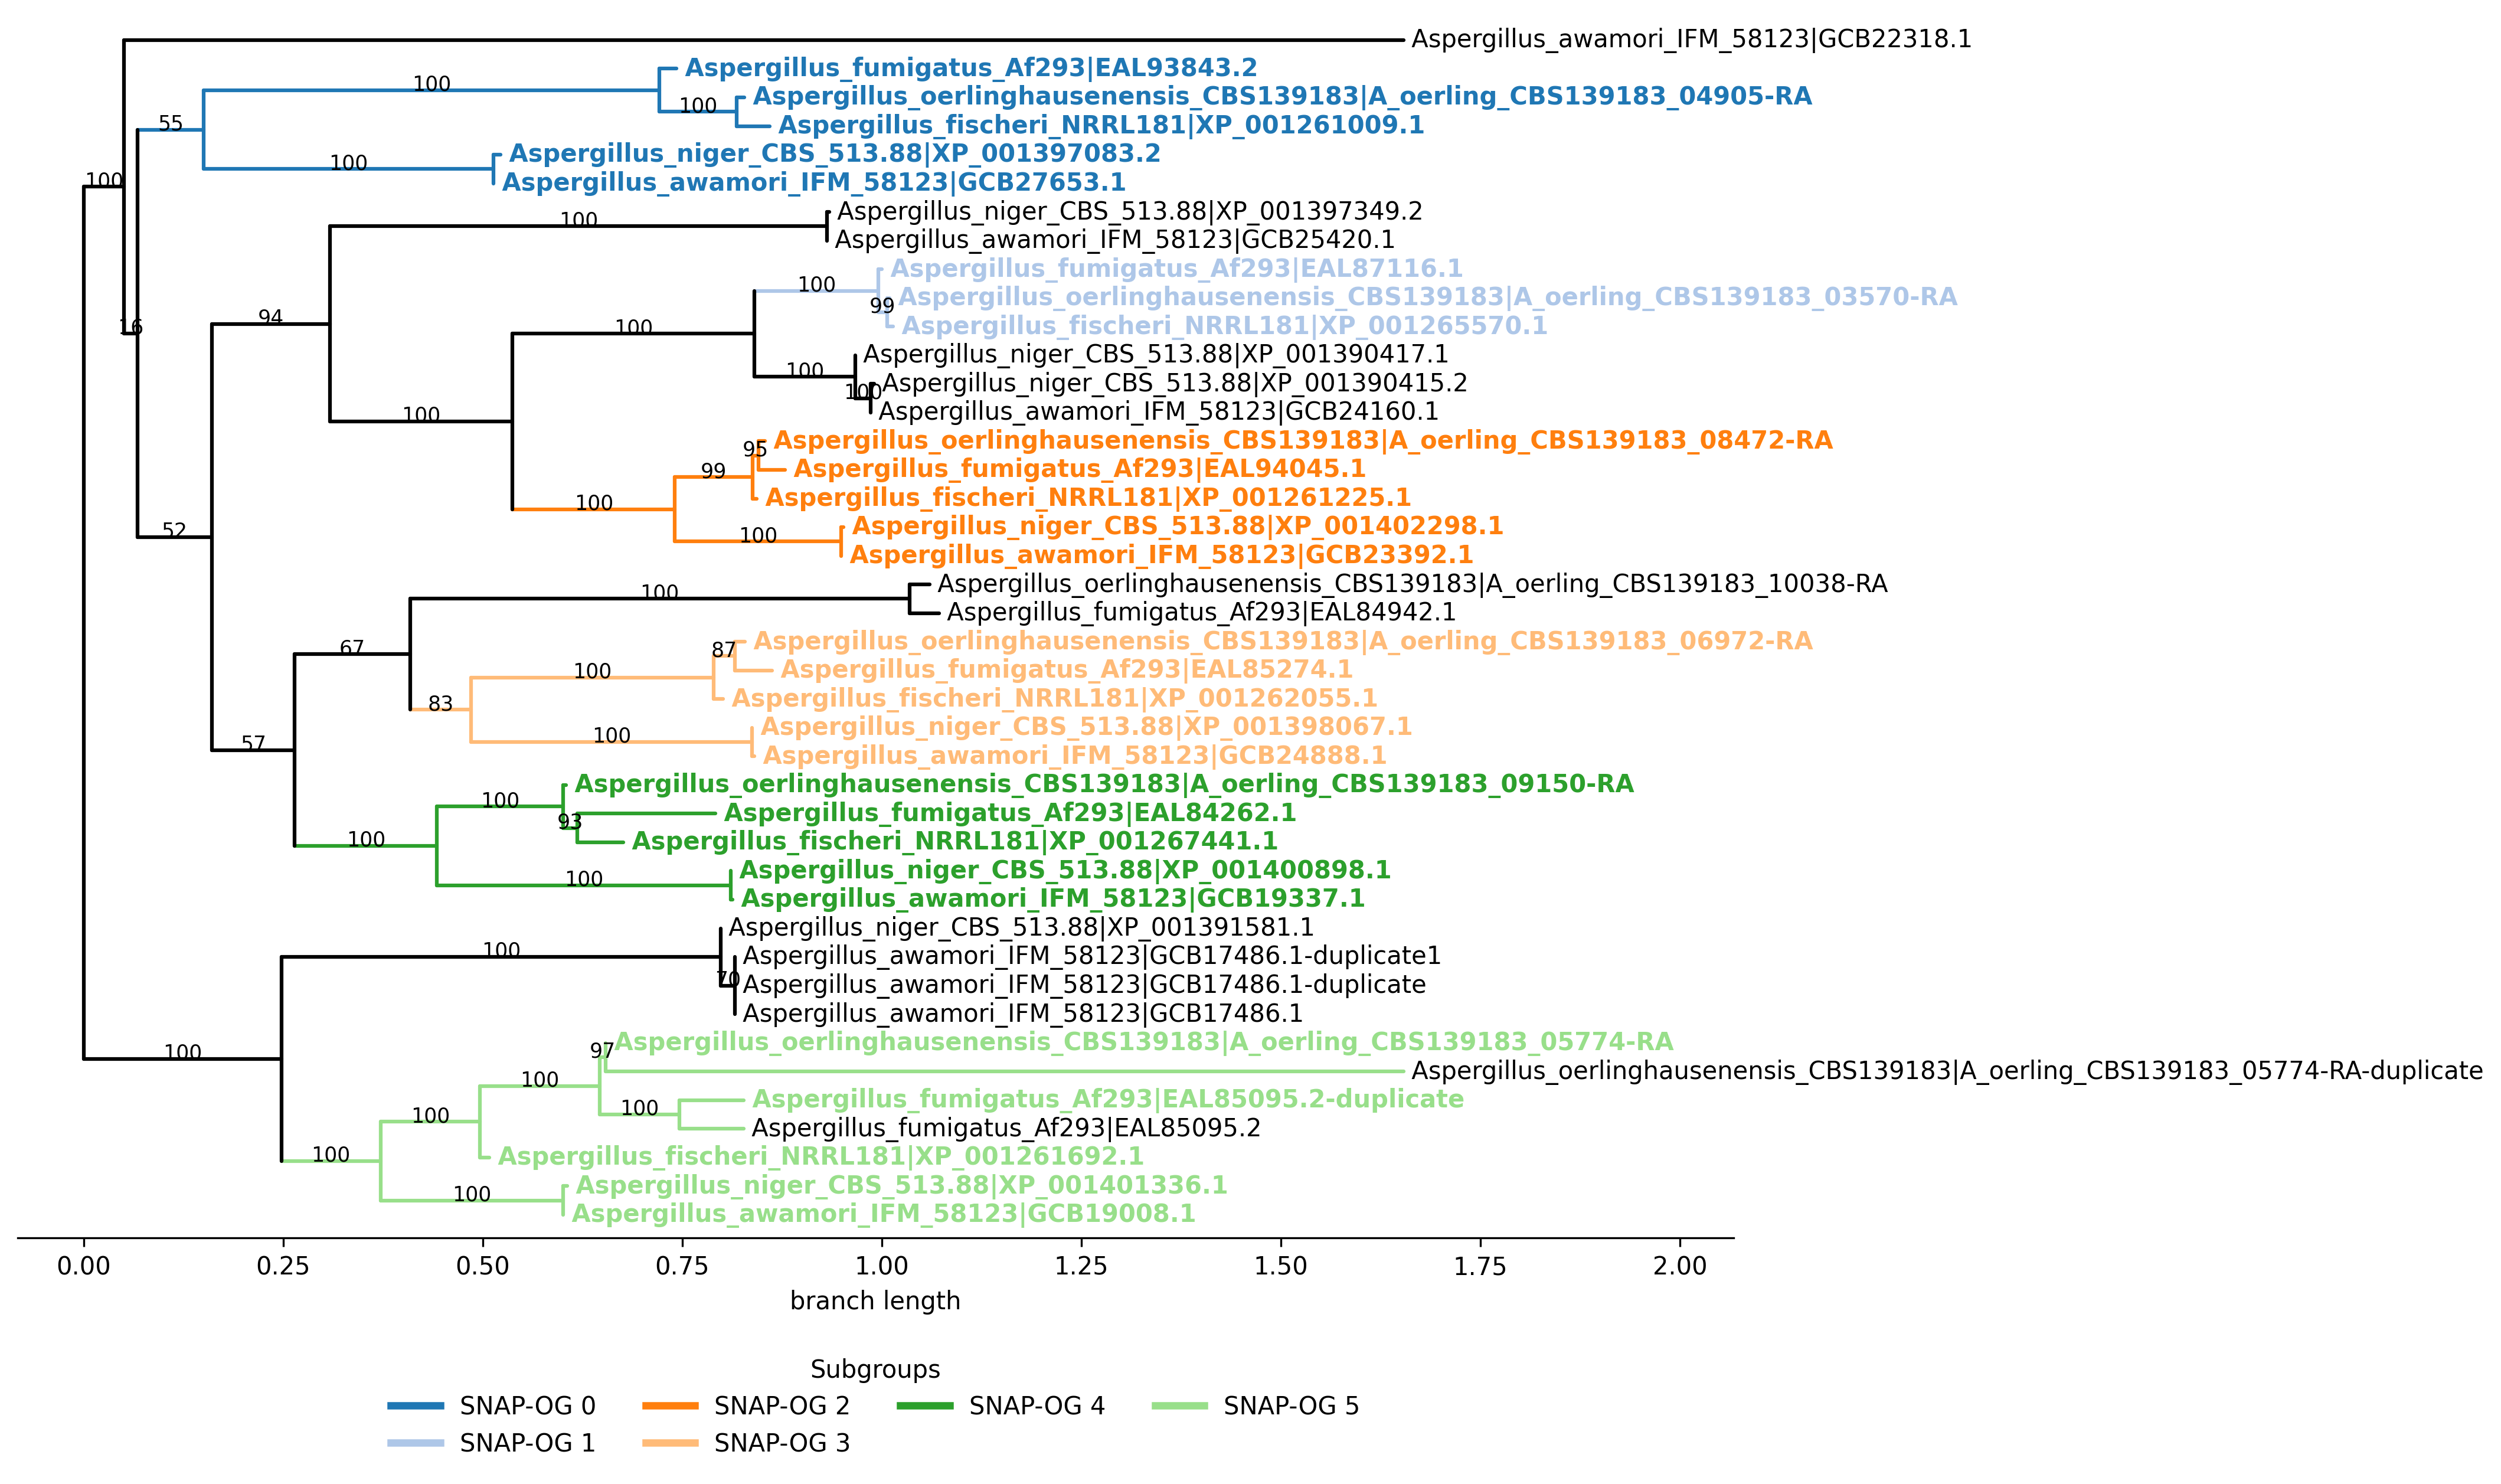
Plotting SNAP-OG assignments
Use -ps/–plot_snap_ogs to create one figure of the full tree with distinct colors for each inferred SNAP-OG. Default plot format is PNG; choose PDF or SVG with -pf/–plot_format.
$ orthosnap -f orthogroup_of_genes.faa -t phylogeny_of_orthogroup_of_genes.tre -ps
$ orthosnap -f orthogroup_of_genes.faa -t phylogeny_of_orthogroup_of_genes.tre -ps -pf svg
Example output (png):
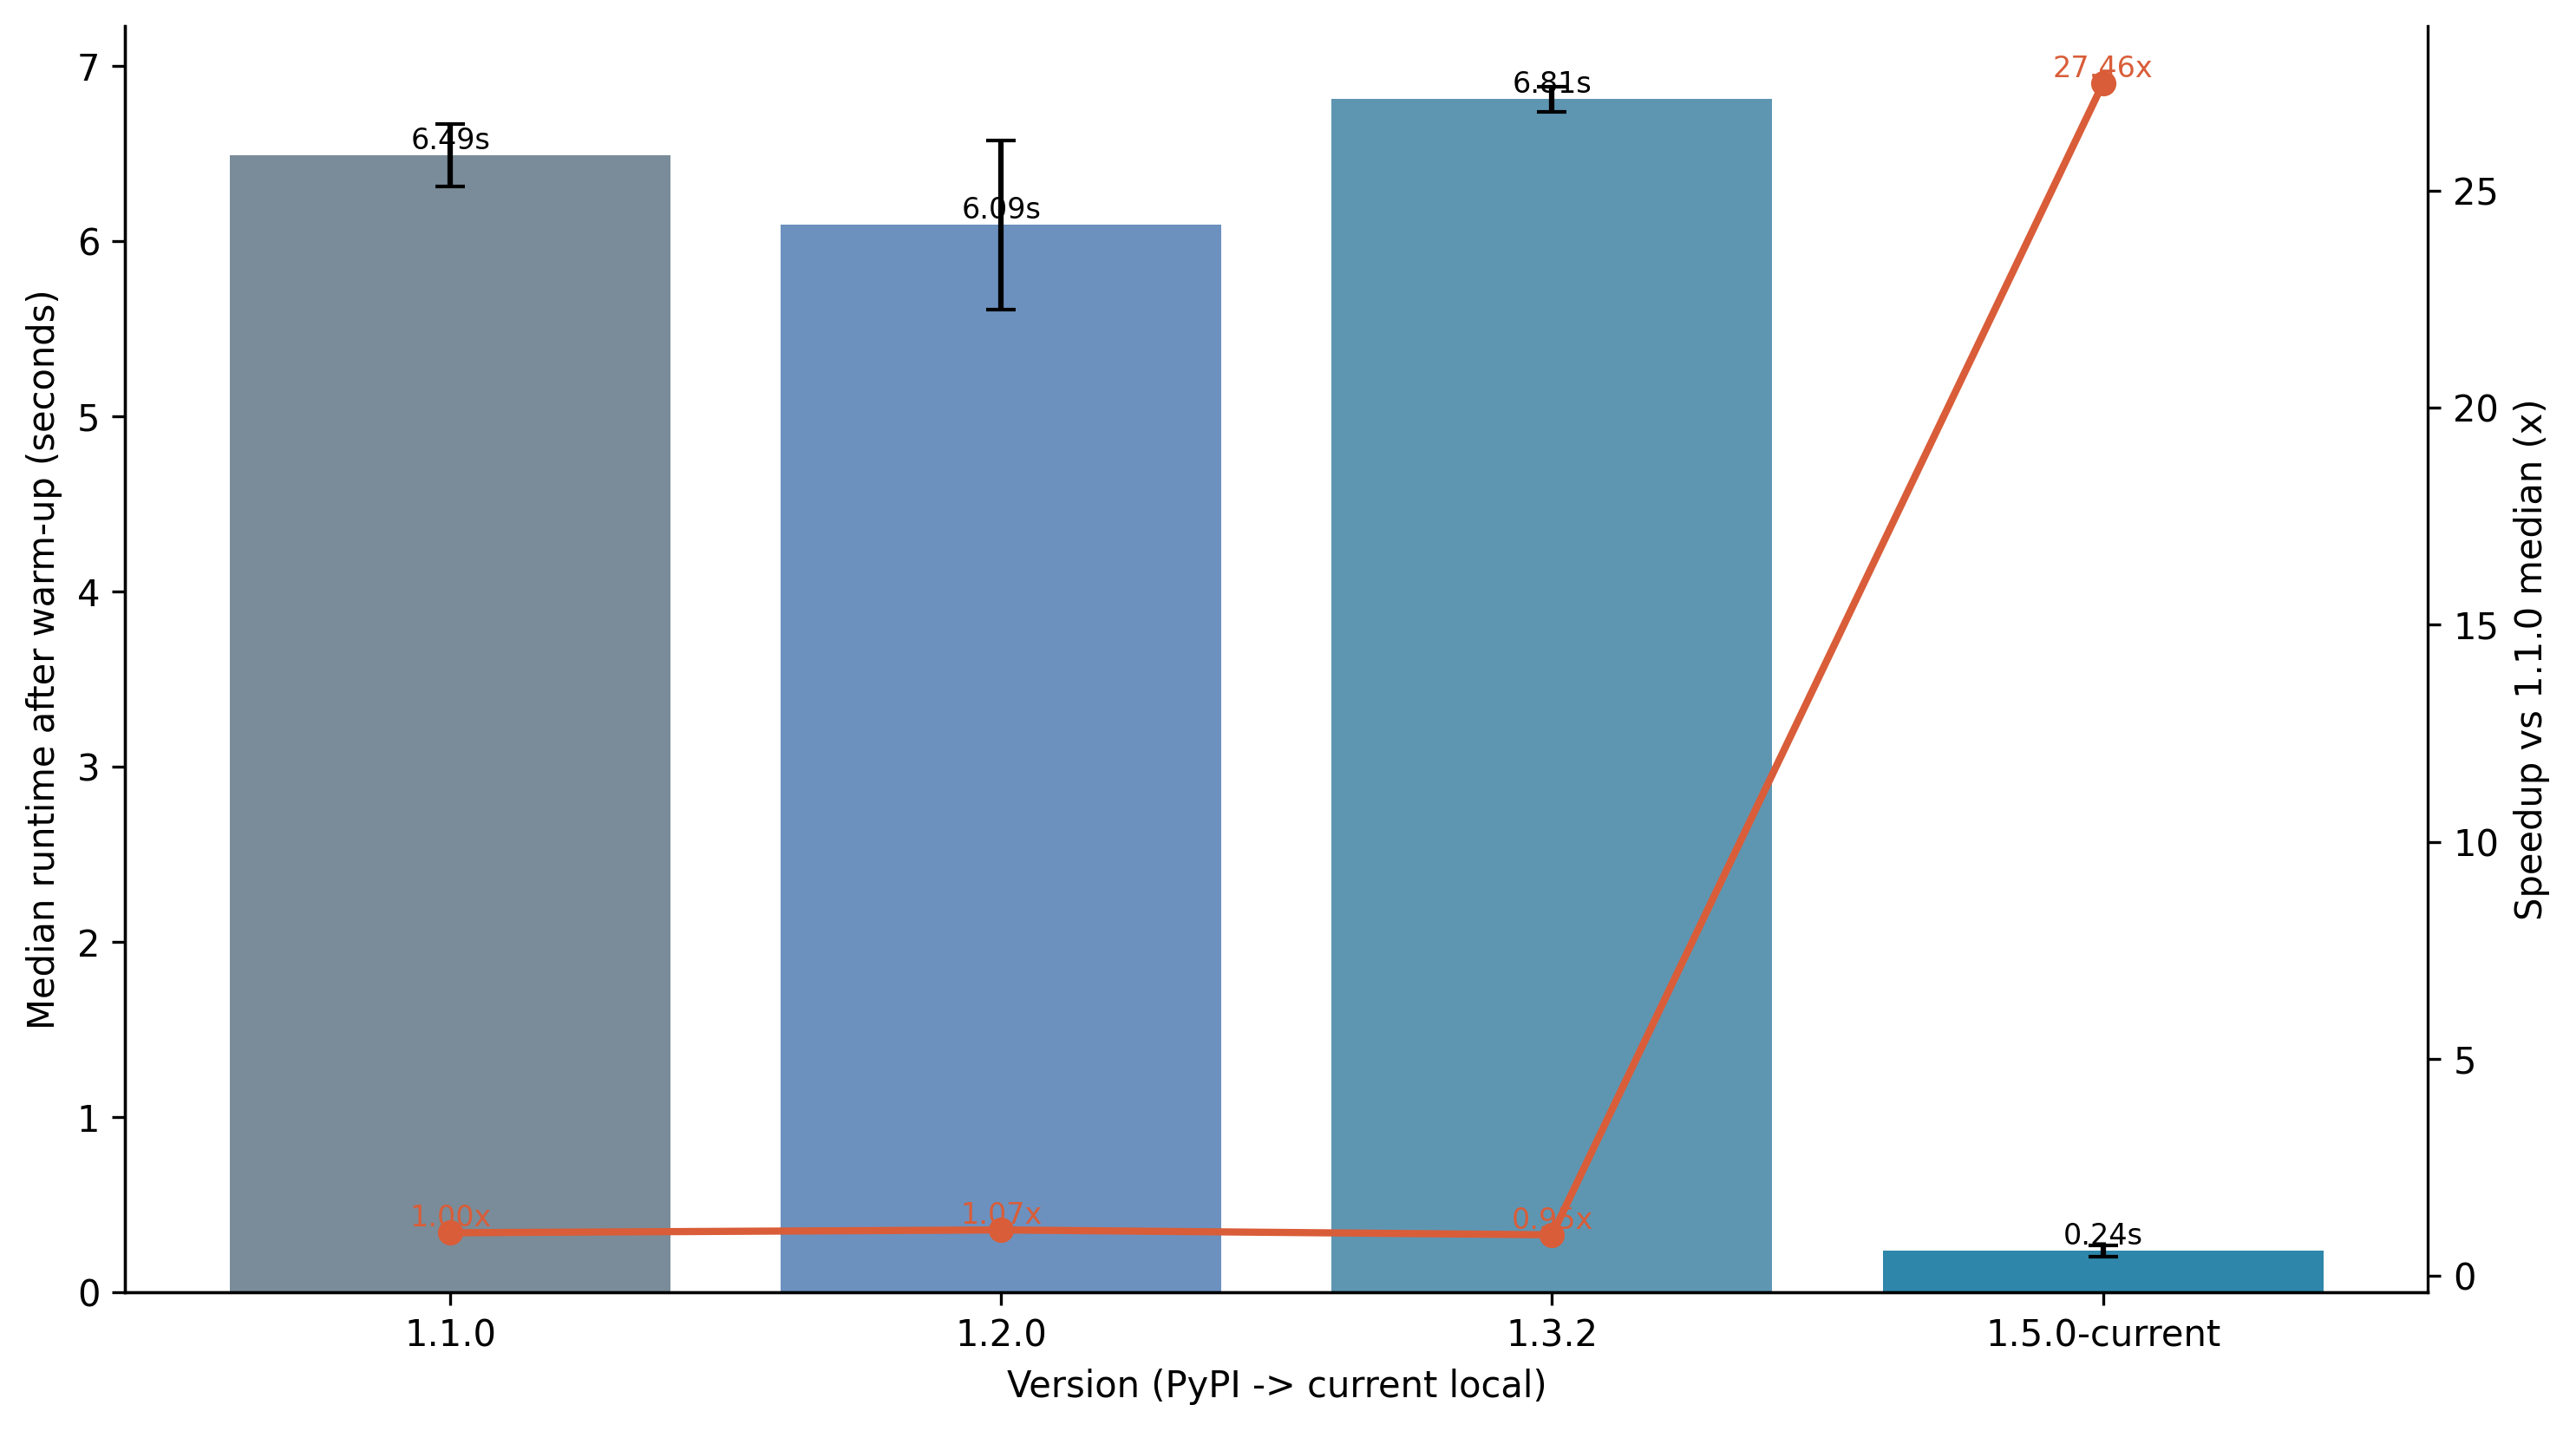
Performance Benchmark
The chart below summarizes benchmarked runtime across selected PyPI releases and the current local version. Runs used a rooted input tree (-r), one warm-up run per version, and three measured runs per version on the same dataset.
The current implementation also includes a deterministic synthetic benchmark for large balanced and
pectinate multi-copy trees. On the documented 640-tip pectinate workload, core extraction is 45.7 times
faster and peak traced Python allocations are 85.6% lower than the pre-optimization baseline. Bootstrap
processing and consensus-tree generation are 9.9 and 18.7 times faster, respectively. The benchmark
generator, exact commands, environment, scaling results, and full tables are maintained in
benchmarks/README.md in the source repository.
Compared versions:
1.1.0 (PyPI baseline)
1.2.0 (PyPI)
1.3.2 (PyPI)
1.6.0-current (local)
All options
Option |
Meaning |
|---|---|
|
Print help message. |
|
Print software version. |
|
Input FASTA file. |
|
Input tree file in Newick format. |
|
Collapse threshold for branch support (default: 80). |
|
Minimum represented taxa for subgroup candidates (default: rounded half of taxa in input FASTA). |
|
Explicit minimum represented-taxa count. |
|
Minimum represented-taxa fraction in |
|
Treat input tree as rooted; otherwise midpoint-root it (default: false). |
|
Delimiter between taxon and sequence IDs (default: |
|
Also write SNAP-OG trees in Newick format (default: false). |
|
Rule for keeping one inparalog among species-specific duplicates (default: |
|
Write tab-delimited inparalog handling report (default: false). |
|
Output directory (default: directory containing input FASTA). |
|
Batch mode: run many jobs from a TSV/CSV manifest. |
|
Validate inputs and exit without running extraction. |
|
Skip runs that already have completed outputs. |
|
Write JSON/TSV provenance and subgroup summaries. |
|
File with bootstrap tree paths (one per line) for consensus subgrouping. |
|
Minimum subgroup frequency required to emit a consensus group (default: 0.5). |
|
In consensus mode, also write one Newick tree per emitted consensus group. |
|
Write one color-coded full-tree plot with subgroup labels (default: false). |
|
Output format for subgroup plot ( |
For genome-scale analyses, consider using the same -o/–occupancy value across all gene families to keep SNAP-OG occupancy thresholds consistent.