Discordance asymmetry
Test for asymmetric discordance (gene flow detection)
Command identity
- Canonical command:
discordance_asymmetry- Handler:
discordance_asymmetry- Aliases:
da, disc_asym
- Standalone executables:
pk_discordance_asymmetry, pk_da, pk_disc_asym
- Categories:
Introgression & gene flow
Runtime interface
Synopsis
phykit discordance_asymmetry --tree <tree> --gene-trees <gene_trees> [--plot <plot_output>] [--verbose] [--annotate] [--fig-width <fig_width>] [--fig-height <fig_height>] [--dpi <dpi>] [--no-title] [--title <title>] [--legend-position <legend_position>] [--ylabel-fontsize <ylabel_fontsize>] [--xlabel-fontsize <xlabel_fontsize>] [--title-fontsize <title_fontsize>] [--axis-fontsize <axis_fontsize>] [--colors <colors>] [--ladderize] [--cladogram] [--circular] [--color-file <color_file>] [--json]
Arguments
This table is generated from the live command parser. It is the authoritative source for accepted spellings, required arguments, types, defaults, and choices.
Argument |
Required |
Type |
Default |
Choices |
|---|---|---|---|---|
|
true |
str |
required |
any |
|
true |
str |
required |
any |
|
false |
str |
none |
any |
|
false |
boolean |
false |
any |
|
false |
boolean |
false |
any |
|
false |
float |
none |
any |
|
false |
float |
none |
any |
|
false |
int |
300 |
any |
|
false |
boolean |
false |
any |
|
false |
str |
none |
any |
|
false |
str |
none |
any |
|
false |
float |
none |
any |
|
false |
float |
none |
any |
|
false |
float |
none |
any |
|
false |
float |
none |
any |
|
false |
str |
none |
any |
|
false |
boolean |
false |
any |
|
false |
boolean |
false |
any |
|
false |
boolean |
false |
any |
|
false |
str |
none |
any |
|
false |
boolean |
false |
any |
Output and errors
--json provides the command's structured JSON representation. Unless the guidance below states otherwise, results are emitted as command output. Invalid command syntax exits with status 2. Input
validation and scientific limitations are described in the guidance below.
Guidance, interpretation, and examples
Test whether the two discordant NNI alternative topologies at each species tree branch are equally frequent. Under incomplete lineage sorting (ILS) alone, the two minor NNI alternatives (gDF1 and gDF2) should appear at equal frequency. When they are significantly asymmetric, it suggests introgression or gene flow between specific lineages.
For each internal branch of the species tree, a two-sided binomial test (H0: P(alt1) = 0.5) is applied, and p-values are corrected for multiple testing using Benjamini-Hochberg FDR.
Interpreting the plot: When --plot is used, branches are colored by
the asymmetry ratio = max(gDF1, gDF2) / (gDF1 + gDF2):
Blue/cool colors (ratio ~ 0.5): The two discordant topologies are roughly equal, consistent with ILS alone — no evidence of gene flow.
Red/warm colors (ratio → 1.0): One discordant topology is much more frequent than the other, suggesting introgression or gene flow.
Red stars: Branches where the asymmetry is statistically significant (FDR < 0.05) — these are introgression candidates.
Use --annotate to display gCF values on each branch. Use
--ylabel-fontsize 0 to hide tip labels for large trees, and
--legend-position none to hide both the legend and colorbar.
phykit discordance_asymmetry -t <species_tree> -g <gene_trees> [--plot <output>] [-v]
    [--annotate]
    [--fig-width <float>] [--fig-height <float>] [--dpi <int>] [--no-title] [--title <str>]
    [--legend-position <str>] [--ylabel-fontsize <float>] [--xlabel-fontsize <float>]
    [--title-fontsize <float>] [--axis-fontsize <float>] [--colors <str>] [--ladderize] [--cladogram] [--circular] [--color-file <file>] [--json]
Options:
-t/--tree: a species tree file
-g/--gene-trees: multi-Newick file of gene trees (branch lengths not required)
--plot: optional output path for asymmetry phylogram (PNG)
-v/--verbose: print per-branch details
--fig-width: figure width in inches (auto-scaled if omitted)
--fig-height: figure height in inches (auto-scaled if omitted)
--dpi: resolution in DPI (default: 300)
--no-title: hide the plot title
--title: custom title text
--legend-position: legend location (e.g., "upper right", "none" to hide)
--ylabel-fontsize: font size for y-axis labels; 0 to hide
--xlabel-fontsize: font size for x-axis labels; 0 to hide
--title-fontsize: font size for the title
--axis-fontsize: font size for axis labels
--colors: comma-separated colors (hex or named)
--ladderize: ladderize (sort) the tree before plotting
--cladogram: draw cladogram (equal branch lengths, tips aligned) instead of phylogram
--circular: draw circular (radial/fan) phylogram instead of rectangular
--color-file: color annotation file for tip labels, clade ranges, and branch colors (iTOL-inspired TSV format)
--json: optional argument to print results as JSON
Example output:
branch                          n_conc  n_alt1  n_alt2  asym_ratio     binom_p       fdr_p   gene_flow
------------------------------------------------------------------------------------------------------
bear,dog,raccoon                     6       0       1       1.000      1.0000      1.0000           -
bear,raccoon                         7       1       2       0.667      1.0000      1.0000           -
cat,monkey                          10       0       0          NA          NA          NA           -
cat,monkey,weasel                    9       1       0       1.000      1.0000      1.0000           -
sea_lion,seal                        9       1       0       1.000      1.0000      1.0000           -
---
Summary: 4 branches tested, 0 significant (FDR<0.05)
Each row corresponds to an internal branch of the species tree identified by the
smaller partition of taxa. The n_conc column shows concordant gene trees, while
n_alt1 and n_alt2 show the counts for the two NNI alternative topologies.
The asym_ratio is max(n_alt1, n_alt2) / (n_alt1 + n_alt2), ranging from 0.5
(perfectly symmetric) to 1.0 (maximally asymmetric). NA indicates no discordant
gene trees were observed. The binom_p is the two-sided binomial test p-value,
fdr_p is the Benjamini-Hochberg corrected p-value, and gene_flow shows
which NNI alternative is favored when the result is significant (FDR < 0.05).
Interpretation:
Symmetric discordance (asym_ratio near 0.5, not significant): Consistent with ILS alone — both NNI alternatives arise with equal frequency from random coalescent sorting.
Asymmetric discordance (asym_ratio near 1.0, significant): Suggests gene flow or introgression. The favored NNI alternative indicates which lineages are exchanging genetic material. For alt1, gene flow is between the C1 lineage and the S (sibling) lineage; for alt2, gene flow is between C2 and S.
To generate a visualization:
phykit discordance_asymmetry -t <species_tree> -g <gene_trees> --plot asymmetry.png
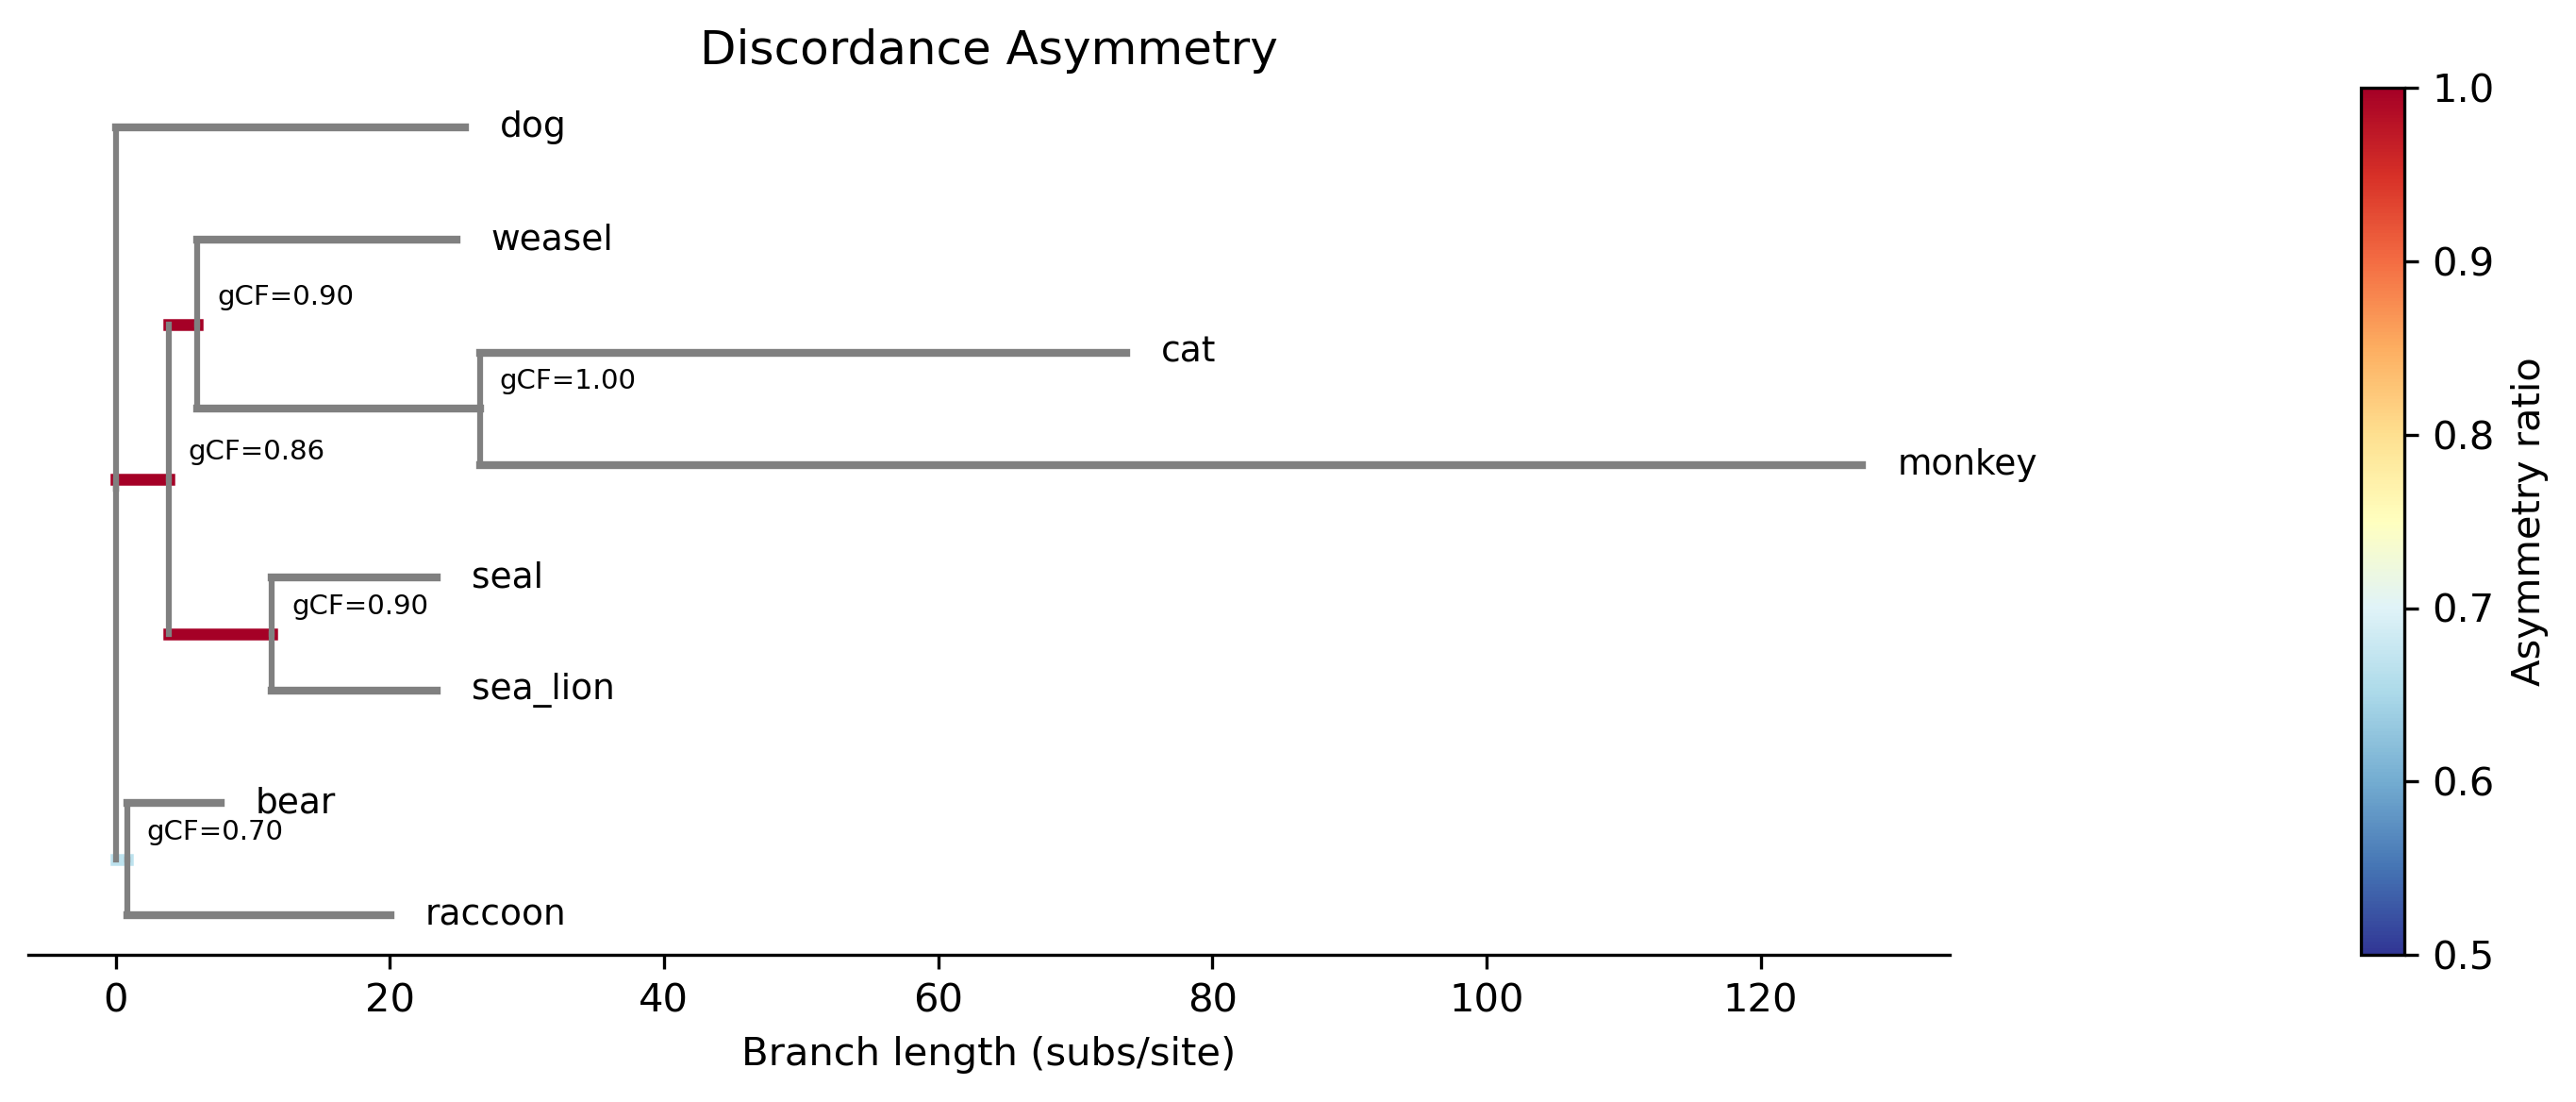
The plot shows a phylogram with internal branches colored by asymmetry ratio using a diverging colormap (blue = symmetric/0.5, red = highly asymmetric/1.0). Significant branches (FDR < 0.05) are marked with a red star. Internal nodes are annotated with gCF values.