Lineage-through-time plot and gamma statistic
Lineage-through-time analysis and gamma statistic
Command identity
- Canonical command:
ltt- Handler:
ltt- Aliases:
gamma, gamma_stat
- Standalone executables:
pk_ltt, pk_gamma, pk_gamma_stat
- Categories:
Tree summary statistics
Runtime interface
Synopsis
phykit ltt --tree <tree> [--verbose] [--plot-output <plot_output>] [--fig-width <fig_width>] [--fig-height <fig_height>] [--dpi <dpi>] [--no-title] [--title <title>] [--legend-position <legend_position>] [--ylabel-fontsize <ylabel_fontsize>] [--xlabel-fontsize <xlabel_fontsize>] [--title-fontsize <title_fontsize>] [--axis-fontsize <axis_fontsize>] [--colors <colors>] [--ladderize] [--cladogram] [--circular] [--color-file <color_file>] [--json]
Arguments
This table is generated from the live command parser. It is the authoritative source for accepted spellings, required arguments, types, defaults, and choices.
Argument |
Required |
Type |
Default |
Choices |
|---|---|---|---|---|
|
true |
str |
required |
any |
|
false |
boolean |
false |
any |
|
false |
str |
none |
any |
|
false |
float |
none |
any |
|
false |
float |
none |
any |
|
false |
int |
300 |
any |
|
false |
boolean |
false |
any |
|
false |
str |
none |
any |
|
false |
str |
none |
any |
|
false |
float |
none |
any |
|
false |
float |
none |
any |
|
false |
float |
none |
any |
|
false |
float |
none |
any |
|
false |
str |
none |
any |
|
false |
boolean |
false |
any |
|
false |
boolean |
false |
any |
|
false |
boolean |
false |
any |
|
false |
str |
none |
any |
|
false |
boolean |
false |
any |
Output and errors
--json provides the command's structured JSON representation. Output-file options: --plot-output. Invalid command syntax exits with status 2. Input
validation and scientific limitations are described in the guidance below.
Guidance, interpretation, and examples
Compute the Pybus & Harvey (2000) gamma statistic and generate lineage-through-time (LTT) plots to test for temporal variation in diversification rates.
Under a constant-rate pure-birth (Yule) process, the gamma statistic follows a standard normal distribution: gamma ~ N(0, 1). Negative values indicate early diversification (decelerating rates, consistent with an adaptive radiation followed by niche filling), while positive values indicate late diversification (accelerating rates, potentially reflecting recent ecological opportunity or mass extinction recovery).
phykit ltt -t <tree> [-v/--verbose] [--plot-output <file>]
    [--fig-width <float>] [--fig-height <float>] [--dpi <int>] [--no-title] [--title <str>]
    [--legend-position <str>] [--ylabel-fontsize <float>] [--xlabel-fontsize <float>]
    [--title-fontsize <float>] [--axis-fontsize <float>] [--colors <str>] [--ladderize] [--cladogram] [--circular] [--color-file <file>] [--json]
Options:
-t/--tree: a rooted phylogeny file with branch lengths (required)
-v/--verbose: print branching times and full LTT data points
--plot-output: output filename for the LTT plot (PNG, PDF, SVG)
--fig-width: figure width in inches (auto-scaled if omitted)
--fig-height: figure height in inches (auto-scaled if omitted)
--dpi: resolution in DPI (default: 300)
--no-title: hide the plot title
--title: custom title text
--legend-position: legend location (e.g., "upper right", "none" to hide)
--ylabel-fontsize: font size for y-axis labels; 0 to hide
--xlabel-fontsize: font size for x-axis labels; 0 to hide
--title-fontsize: font size for the title
--axis-fontsize: font size for axis labels
--colors: comma-separated colors (hex or named)
--ladderize: ladderize (sort) the tree before plotting
--cladogram: draw cladogram (equal branch lengths, tips aligned) instead of phylogram
--circular: draw circular (radial/fan) phylogram instead of rectangular
--color-file: color annotation file for tip labels, clade ranges, and branch colors (iTOL-inspired TSV format)
--json: output results as JSON
Default output: tab-separated gamma statistic and two-tailed p-value.
# Basic gamma statistic
phykit ltt -t species.tre
# -1.4142   0.1573

# With LTT plot
phykit ltt -t species.tre --plot-output ltt_plot.png

# Full JSON output
phykit ltt -t species.tre --json
Tutorial: testing diversification tempo in a clade
Suppose you have a dated phylogeny of 50 gecko species and want to test whether speciation rates were constant or whether diversification decelerated over time (consistent with ecological limits).
Step 1: Compute the gamma statistic.
phykit ltt -t gecko_dated.tre --plot-output gecko_ltt.png
# -2.8514   0.0043
A significantly negative gamma (p = 0.004) rejects the constant-rate null, indicating that lineage accumulation was concentrated early in the clade's history — consistent with an early burst of diversification followed by a slowdown as niches filled.
Step 2: Examine the LTT plot.
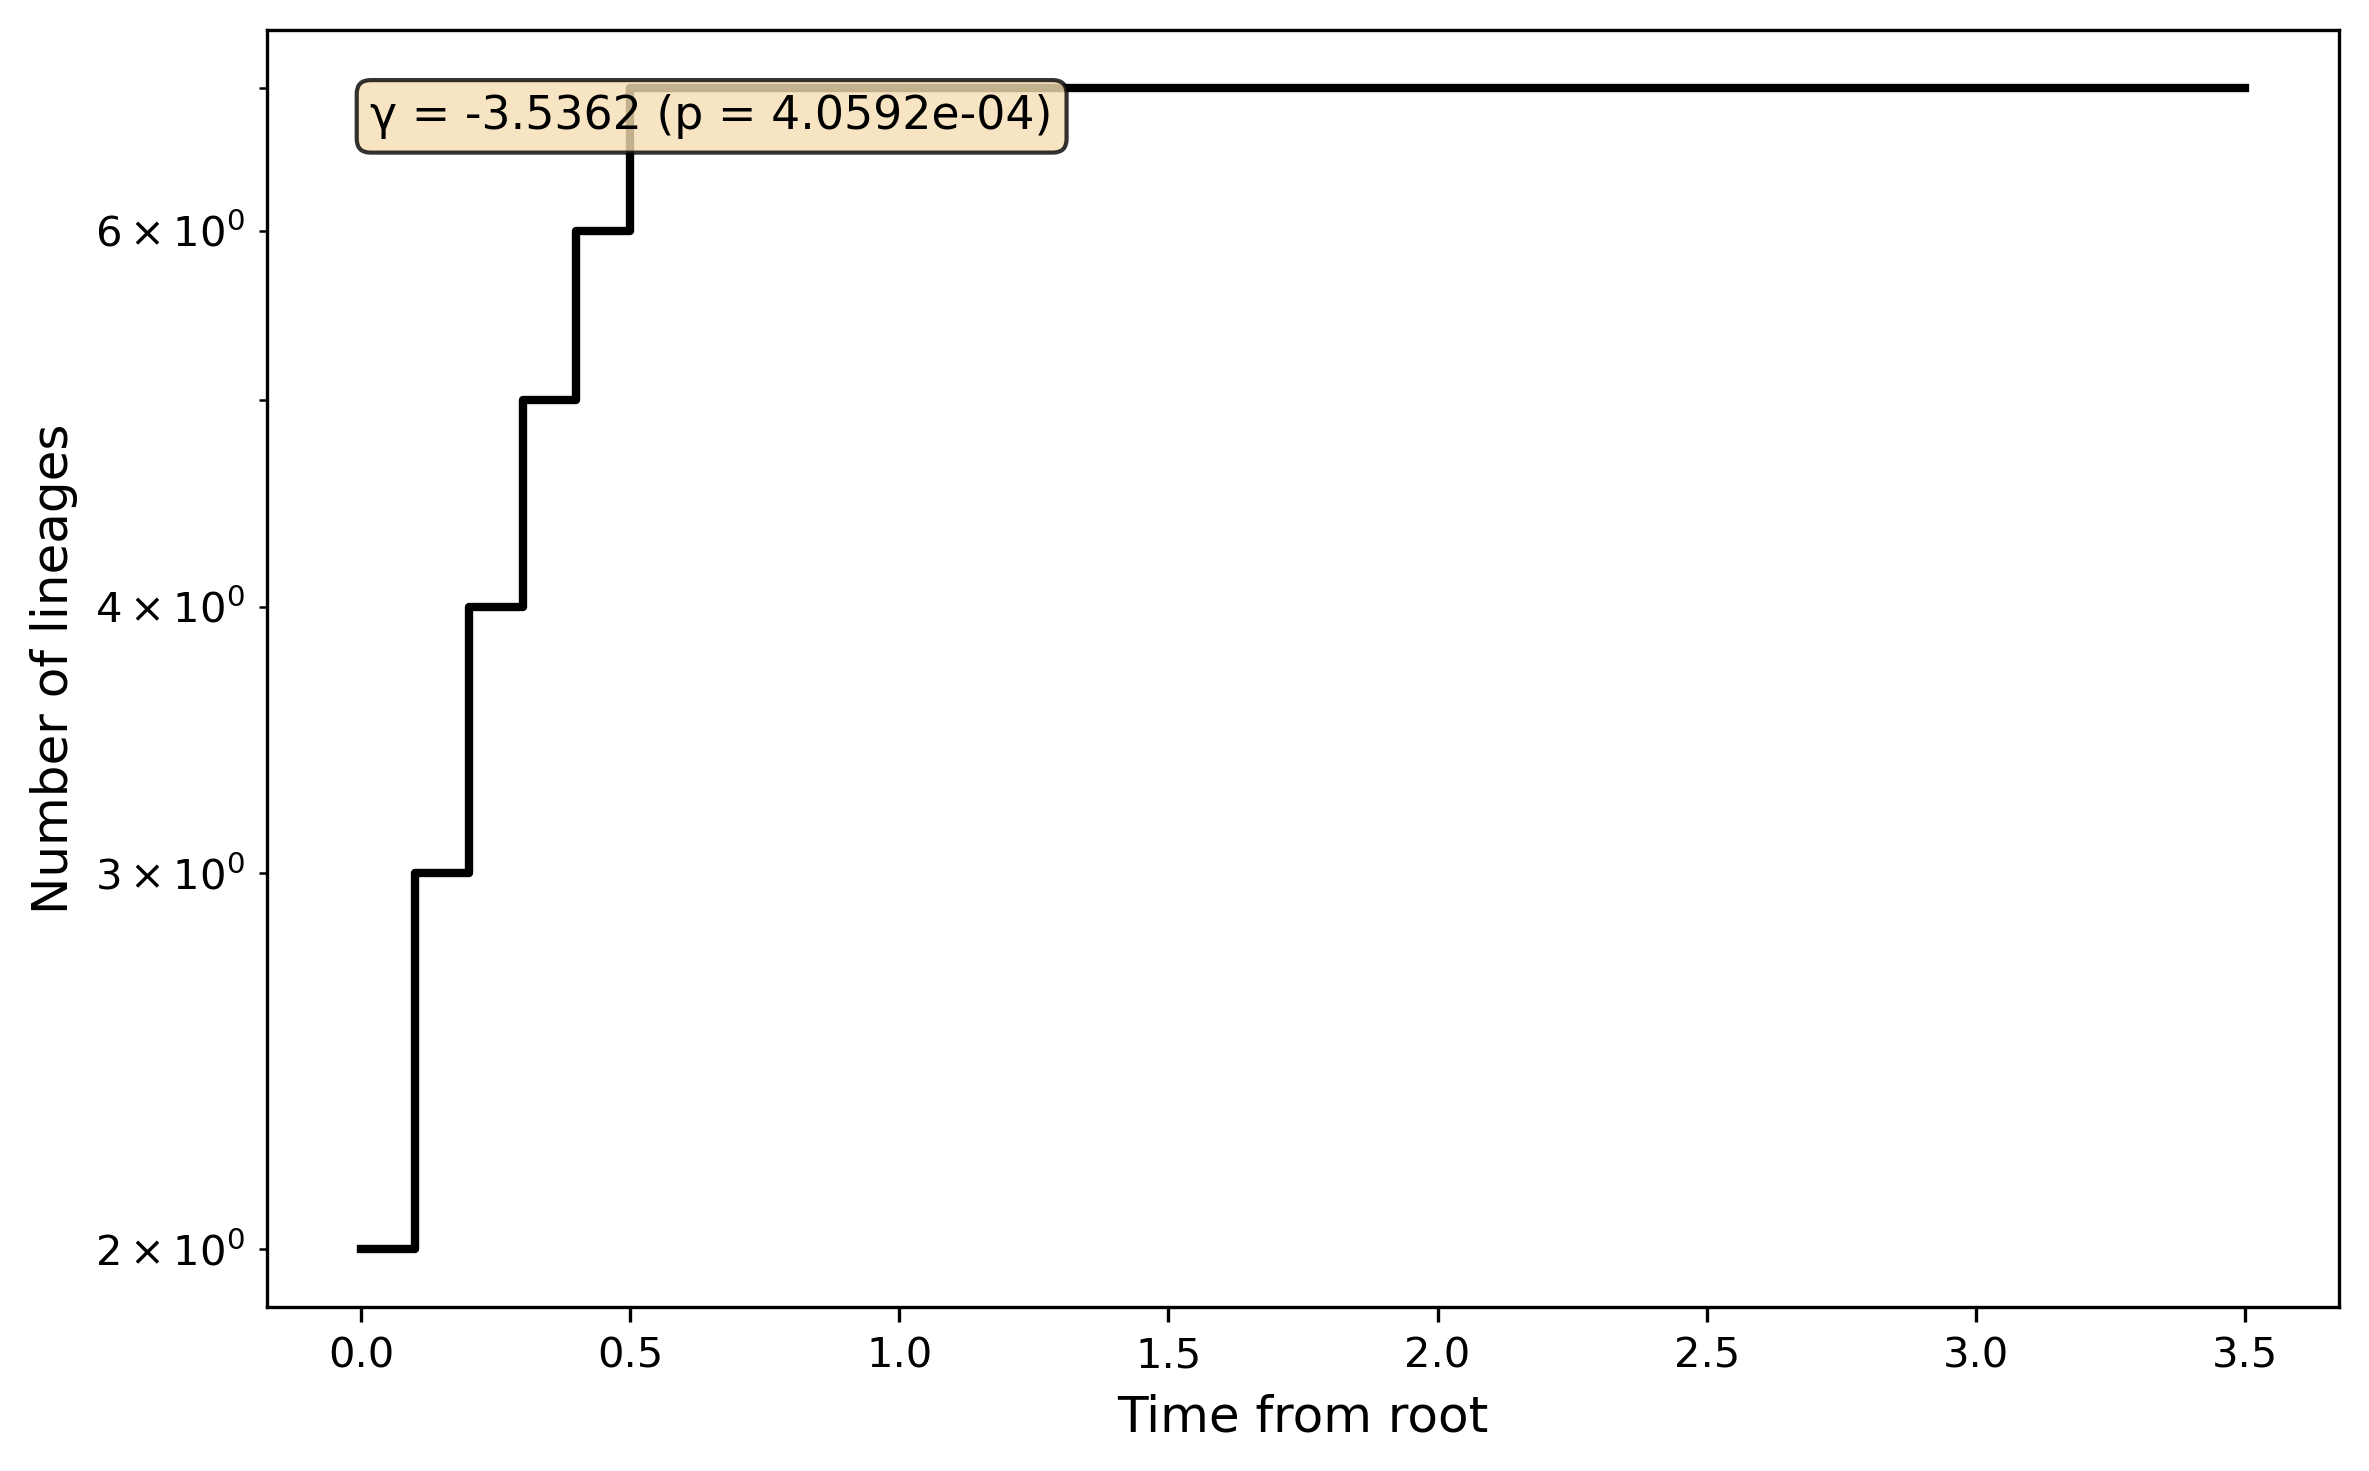
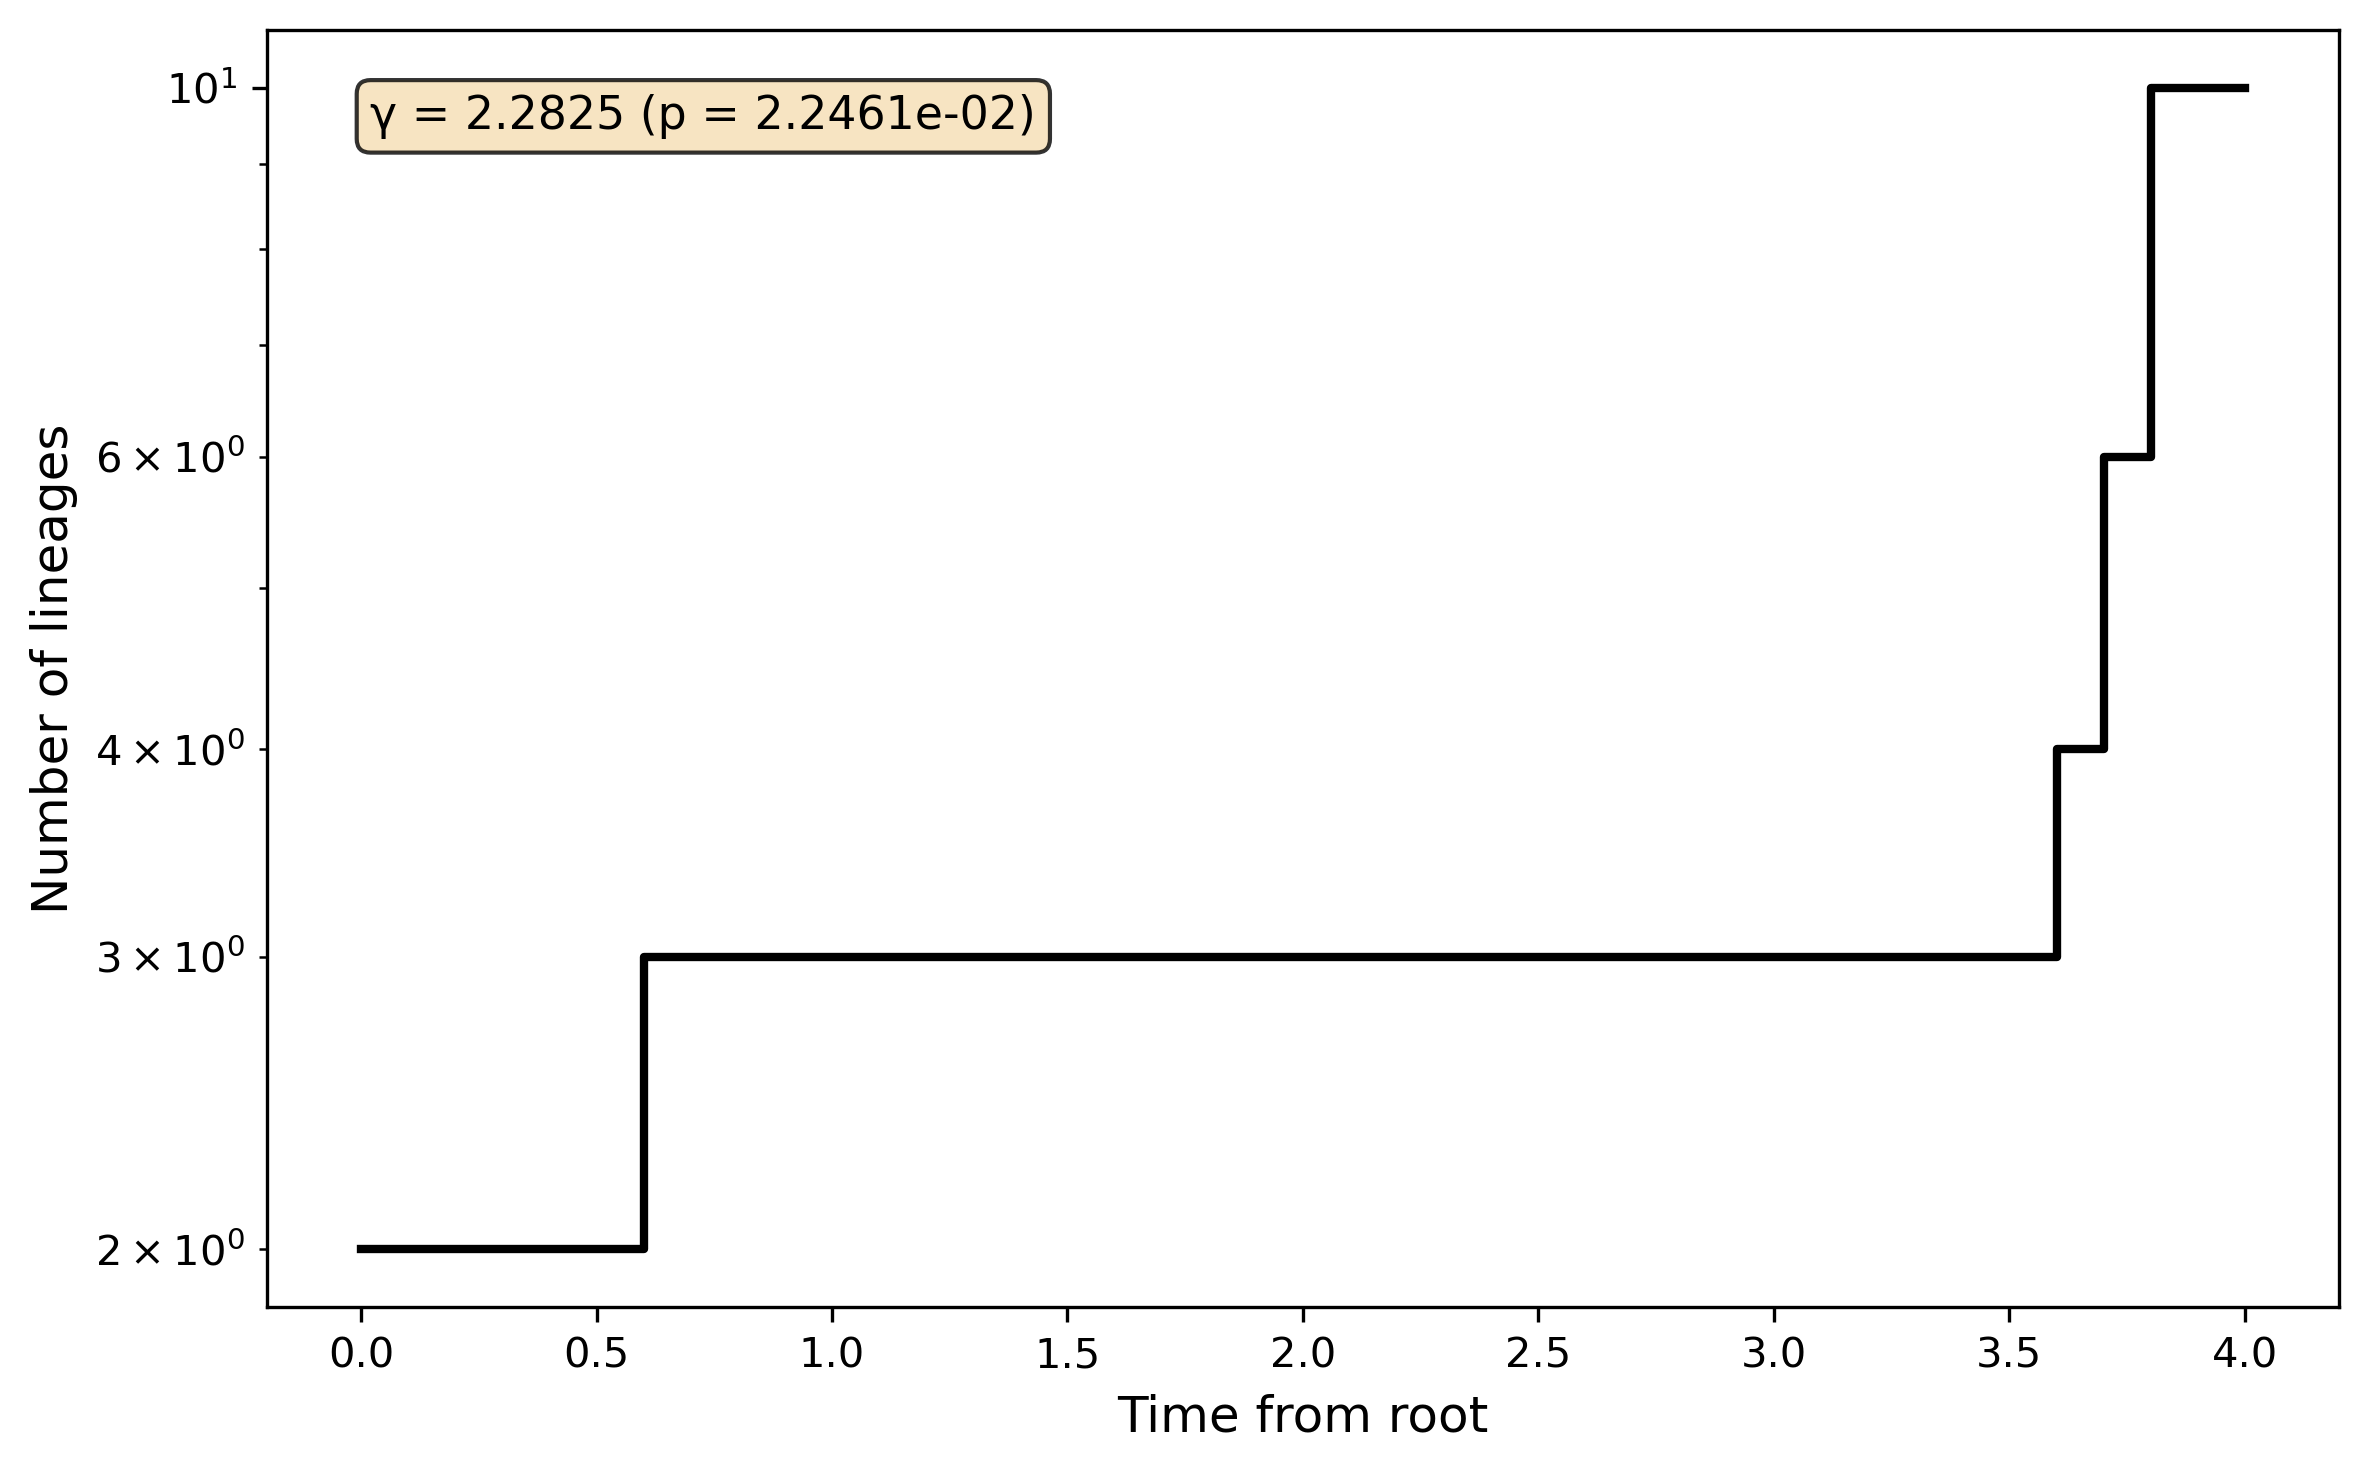
The --plot-output option generates a step-function plot of lineage
count (log scale) vs. time from root. Under constant-rate birth,
lineages accumulate exponentially (straight line on log-scale). An
early burst appears as a curve that rises steeply then flattens.
Example: early burst (decelerating diversification)
Most branching events occur near the root, then the curve plateaus. The significantly negative gamma (p < 0.001) rejects constant-rate birth.
Example: recent burst (accelerating diversification)
Lineage accumulation is concentrated near the present. The significantly positive gamma (p = 0.022) indicates late diversification.
Step 3: Verbose output for downstream analysis.
phykit ltt -t gecko_dated.tre -v
Verbose mode prints branching times (node ages) and the full LTT data table (time_from_root, n_lineages), which can be piped to custom plotting or further analysis.
Validation against R's ape::gammaStat()
PhyKIT's gamma statistic was validated against R's ape package (v5.8.1, R 4.4.0). Results match to 10 decimal places:
Tree topology |
PhyKIT gamma |
R ape gamma |
|---|---|---|
Balanced 8-tip |
-1.4142135624 |
-1.4142135624 |
Ladder (caterpillar) 5-tip |
-0.7142857143 |
-0.7142857143 |
Recent burst 10-tip |
2.2824790785 |
2.2824790785 |
Early burst 7-tip |
-3.5362021857 |
-3.5362021857 |
The algorithm replicates the exact formula from ape's gammaStat.R
source, including the rev() step on internode intervals.