Relative rate test
Relative rate test between lineages
Command identity
- Canonical command:
relative_rate_test- Handler:
relative_rate_test- Aliases:
rrt, tajima_rrt
- Standalone executables:
pk_relative_rate_test, pk_rrt, pk_tajima_rrt
- Categories:
Evolutionary rate analysis
Runtime interface
Synopsis
phykit relative_rate_test [--alignment <alignment>] [--alignment-list <alignment_list>] --tree <tree> [--verbose] [--plot-output <plot_output>] [--fig-width <fig_width>] [--fig-height <fig_height>] [--dpi <dpi>] [--no-title] [--title <title>] [--legend-position <legend_position>] [--ylabel-fontsize <ylabel_fontsize>] [--xlabel-fontsize <xlabel_fontsize>] [--title-fontsize <title_fontsize>] [--axis-fontsize <axis_fontsize>] [--colors <colors>] [--ladderize] [--cladogram] [--circular] [--color-file <color_file>] [--json]
Arguments
This table is generated from the live command parser. It is the authoritative source for accepted spellings, required arguments, types, defaults, and choices.
Argument |
Required |
Type |
Default |
Choices |
|---|---|---|---|---|
|
false |
str |
none |
any |
|
false |
str |
none |
any |
|
true |
str |
required |
any |
|
false |
boolean |
false |
any |
|
false |
str |
none |
any |
|
false |
float |
none |
any |
|
false |
float |
none |
any |
|
false |
int |
300 |
any |
|
false |
boolean |
false |
any |
|
false |
str |
none |
any |
|
false |
str |
none |
any |
|
false |
float |
none |
any |
|
false |
float |
none |
any |
|
false |
float |
none |
any |
|
false |
float |
none |
any |
|
false |
str |
none |
any |
|
false |
boolean |
false |
any |
|
false |
boolean |
false |
any |
|
false |
boolean |
false |
any |
|
false |
str |
none |
any |
|
false |
boolean |
false |
any |
Output and errors
--json provides the command's structured JSON representation. Output-file options: --plot-output. Invalid command syntax exits with status 2. Input
validation and scientific limitations are described in the guidance below.
Guidance, interpretation, and examples
Tajima's relative rate test (Tajima, Genetics, 1993).
Tests whether two ingroup lineages have evolved at equal rates since diverging from their common ancestor. The outgroup is automatically inferred from the rooted tree as the earliest-diverging taxon (the single taxon on the smaller side of the root split). All pairwise ingroup combinations are tested with Bonferroni and Benjamini-Hochberg FDR multiple testing correction.
At each alignment column, the test classifies informative sites:
m1: the first ingroup taxon differs from the outgroup, but the second matches
m2: the second ingroup taxon differs from the outgroup, but the first matches
Sites where both differ or both match the outgroup are uninformative and skipped
Sites with gaps or ambiguous characters are skipped
Test statistic: chi2 = (m1 - m2)^2 / (m1 + m2), with 1 degree of freedom.
Single alignment mode:
phykit relative_rate_test -a <alignment> -t <rooted_tree> [-v/--verbose]
    [--plot-output <path>] [--fig-width <float>] [--fig-height <float>] [--dpi <int>]
    [--no-title] [--title <str>] [--legend-position <str>] [--ylabel-fontsize <float>]
    [--xlabel-fontsize <float>] [--title-fontsize <float>] [--axis-fontsize <float>]
    [--colors <str>] [--ladderize] [--cladogram] [--circular] [--color-file <file>] [--json]
Batch mode (multiple alignments, one shared tree):
phykit relative_rate_test -l <alignment_list> -t <rooted_tree> [-v/--verbose]
    [--plot-output <path>] [--fig-width <float>] [--fig-height <float>] [--dpi <int>]
    [--no-title] [--title <str>] [--legend-position <str>] [--ylabel-fontsize <float>]
    [--xlabel-fontsize <float>] [--title-fontsize <float>] [--axis-fontsize <float>]
    [--colors <str>] [--ladderize] [--cladogram] [--circular] [--color-file <file>] [--json]
Options:
-a/--alignment: a single alignment file
-l/--alignment-list: a file with one alignment path per line (batch mode)
-t/--tree: a rooted tree file
-v/--verbose: print additional detail
--plot-output: save a pairwise p-value heatmap to this path
--fig-width: figure width in inches (auto-scaled if omitted)
--fig-height: figure height in inches (auto-scaled if omitted)
--dpi: resolution in DPI (default: 300)
--no-title: hide the plot title
--title: custom title text
--legend-position: legend location (e.g., "upper right", "none" to hide)
--ylabel-fontsize: font size for y-axis labels; 0 to hide
--xlabel-fontsize: font size for x-axis labels; 0 to hide
--title-fontsize: font size for the title
--axis-fontsize: font size for axis labels
--colors: comma-separated colors (hex or named)
--ladderize: ladderize (sort) the tree before plotting
--cladogram: draw cladogram (equal branch lengths, tips aligned) instead of phylogram
--circular: draw circular (radial/fan) phylogram instead of rectangular
--color-file: color annotation file for tip labels, clade ranges, and branch colors (iTOL-inspired TSV format)
--json: optional argument to print results as JSON
Single mode outputs one row per ingroup pair with m1, m2, chi-squared, raw p-value, Bonferroni-corrected p-value, FDR-corrected p-value, and a significance indicator. Batch mode aggregates across genes, reporting the number and percentage of genes rejecting equal rates for each pair.
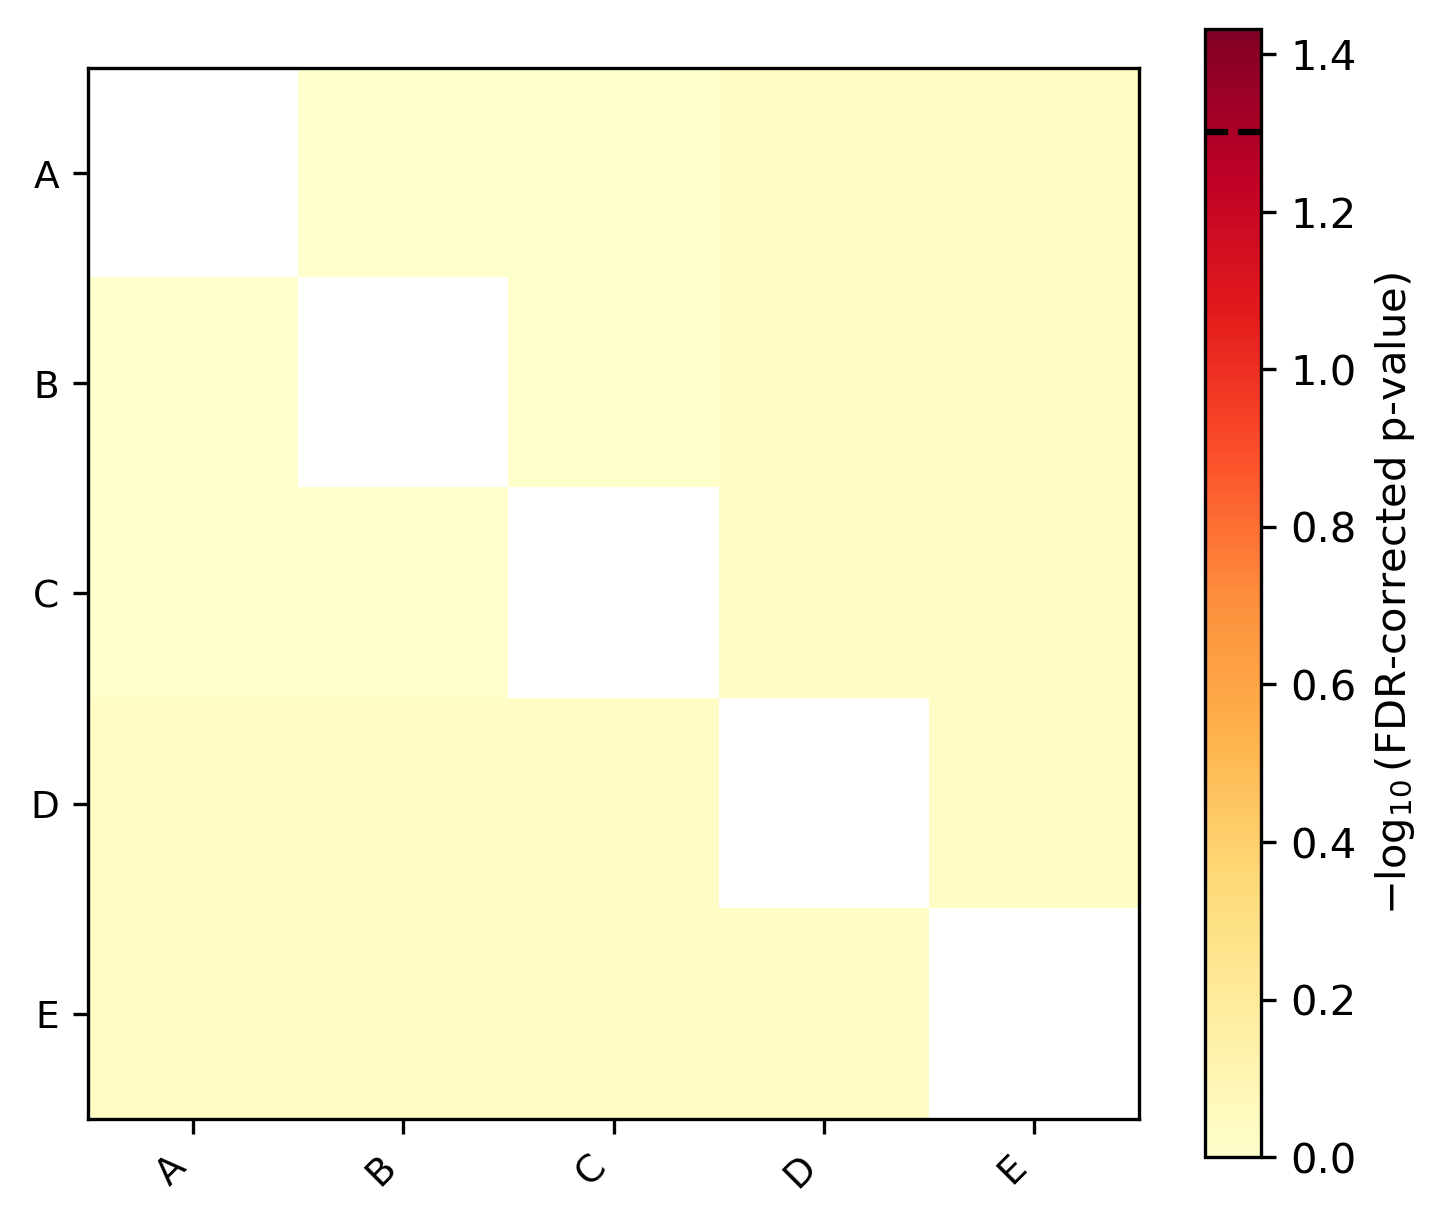
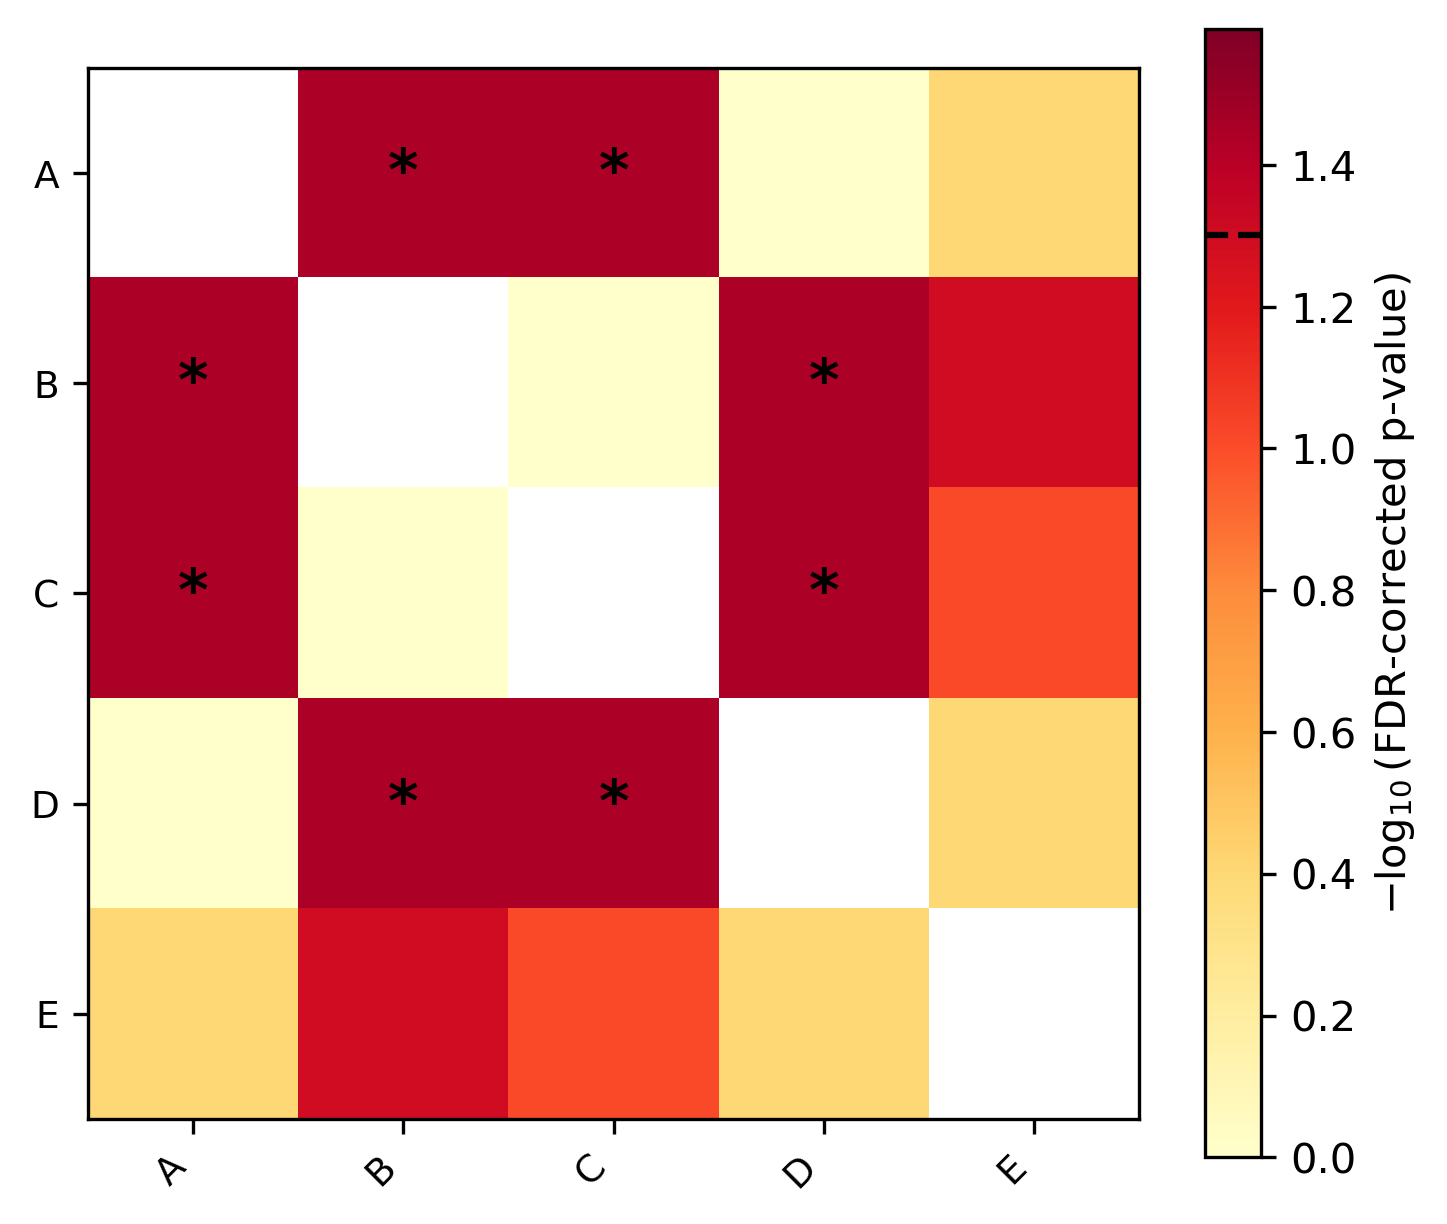
When --plot-output is provided, a symmetric heatmap of
-log10(FDR-corrected p-values) is saved. Cells with significant
pairs (FDR < 0.05) are marked with an asterisk. Darker colors
indicate stronger evidence for unequal evolutionary rates.
The dashed line on the colorbar marks the significance threshold
(-log10(0.05) ≈ 1.3); cells above this line are significant.
Equal rates — all taxa evolve at similar rates, so no pairwise comparison reaches significance. The heatmap is uniformly pale with no asterisks:
Unequal rates — taxa B and C have accumulated many more substitutions
than A and D. Significant pairs (dark red, marked with *) indicate
lineages evolving at detectably different rates:
Validated against R's pegas::rr.test() — chi-squared and p-values
match to machine precision.