Evolutionary tempo mapping
Detect rate-topology associations in gene trees
Command identity
- Canonical command:
evo_tempo_map- Handler:
evo_tempo_map- Aliases:
etm
- Standalone executables:
pk_evo_tempo_map, pk_etm
- Categories:
Tree comparison & consensus
Runtime interface
Synopsis
phykit evo_tempo_map --tree <tree> --gene-trees <gene_trees> [--plot <plot_output>] [--verbose] [--fig-width <fig_width>] [--fig-height <fig_height>] [--dpi <dpi>] [--no-title] [--title <title>] [--legend-position <legend_position>] [--ylabel-fontsize <ylabel_fontsize>] [--xlabel-fontsize <xlabel_fontsize>] [--title-fontsize <title_fontsize>] [--axis-fontsize <axis_fontsize>] [--colors <colors>] [--ladderize] [--cladogram] [--circular] [--color-file <color_file>] [--json]
Arguments
This table is generated from the live command parser. It is the authoritative source for accepted spellings, required arguments, types, defaults, and choices.
Argument |
Required |
Type |
Default |
Choices |
|---|---|---|---|---|
|
true |
str |
required |
any |
|
true |
str |
required |
any |
|
false |
str |
none |
any |
|
false |
boolean |
false |
any |
|
false |
float |
none |
any |
|
false |
float |
none |
any |
|
false |
int |
300 |
any |
|
false |
boolean |
false |
any |
|
false |
str |
none |
any |
|
false |
str |
none |
any |
|
false |
float |
none |
any |
|
false |
float |
none |
any |
|
false |
float |
none |
any |
|
false |
float |
none |
any |
|
false |
str |
none |
any |
|
false |
boolean |
false |
any |
|
false |
boolean |
false |
any |
|
false |
boolean |
false |
any |
|
false |
str |
none |
any |
|
false |
boolean |
false |
any |
Output and errors
--json provides the command's structured JSON representation. Unless the guidance below states otherwise, results are emitted as command output. Invalid command syntax exits with status 2. Input
validation and scientific limitations are described in the guidance below.
Guidance, interpretation, and examples
Detect rate-topology associations by comparing branch length distributions between concordant and discordant gene trees at each species tree branch.
Under the multispecies coalescent, discordant gene trees should have shorter internal branches near the discordant node (because the coalescence happened deeper, in the ancestral population). Deviations from this expectation suggest substitution rate heterogeneity correlated with topology, which could indicate adaptive evolution, different selective pressures in hybridizing lineages, or systematic error from model misspecification.
For each internal branch of the species tree, gene trees are classified as concordant or discordant via bipartition matching (same as gCF). The homologous branch length is extracted from each gene tree and the two groups are compared using a Mann-Whitney U test and a permutation test (1000 permutations). P-values are corrected for multiple testing using Benjamini-Hochberg FDR.
A global treeness (internal/total branch length ratio) comparison between concordant and discordant gene trees is also reported.
phykit evo_tempo_map -t <species_tree> -g <gene_trees> [--plot <output>] [-v]
    [--fig-width <float>] [--fig-height <float>] [--dpi <int>] [--no-title] [--title <str>]
    [--legend-position <str>] [--ylabel-fontsize <float>] [--xlabel-fontsize <float>]
    [--title-fontsize <float>] [--axis-fontsize <float>] [--colors <str>] [--ladderize] [--cladogram] [--circular] [--color-file <file>] [--json]
Options:
-t/--tree: a species tree file
-g/--gene-trees: multi-Newick file of gene trees with branch lengths
--plot: optional output path for box/strip plot (PNG)
-v/--verbose: print per-gene-tree classification details
--fig-width: figure width in inches (auto-scaled if omitted)
--fig-height: figure height in inches (auto-scaled if omitted)
--dpi: resolution in DPI (default: 300)
--no-title: hide the plot title
--title: custom title text
--legend-position: legend location (e.g., "upper right", "none" to hide)
--ylabel-fontsize: font size for y-axis labels; 0 to hide
--xlabel-fontsize: font size for x-axis labels; 0 to hide
--title-fontsize: font size for the title
--axis-fontsize: font size for axis labels
--colors: comma-separated colors (hex or named)
--ladderize: ladderize (sort) the tree before plotting
--cladogram: draw cladogram (equal branch lengths, tips aligned) instead of phylogram
--circular: draw circular (radial/fan) phylogram instead of rectangular
--color-file: color annotation file for tip labels, clade ranges, and branch colors (iTOL-inspired TSV format)
--json: optional argument to print results as JSON
Example output:
branch                          n_conc  n_disc    med_conc    med_disc      U_pval   perm_pval       fdr_p
----------------------------------------------------------------------------------------------------------
bear,dog,raccoon                     6       1    3.875000    3.600000          NA          NA          NA
bear,raccoon                         7       3    0.880000    0.700000    0.516667    0.077000    0.516667
cat,monkey                          10       0   20.450000          NA          NA          NA          NA
cat,monkey,weasel                    9       1    2.120000    2.800000          NA          NA          NA
sea_lion,seal                        9       1    7.500000    7.200000          NA          NA          NA
---
Global treeness: concordant=0.126489 (n=6), discordant=0.119014 (n=4)
Branches tested: 1, significant (FDR<0.05): 0
Each row corresponds to an internal branch of the species tree identified by the
smaller partition of taxa. The n_conc and n_disc columns show how many gene
trees are concordant or discordant at that branch. The med_conc and med_disc
columns show the median branch length (in substitutions/site) for each group. The
U_pval is the two-sided Mann-Whitney U test p-value, perm_pval is the
permutation test p-value (1000 permutations), and fdr_p is the
Benjamini-Hochberg corrected p-value. Branches with fewer than 2 gene trees
in either group show NA for p-values.
The global treeness comparison tests whether concordant gene trees have systematically different ratios of internal to total branch lengths.
To generate a visualization:
phykit evo_tempo_map -t <species_tree> -g <gene_trees> --plot tempo_map.png
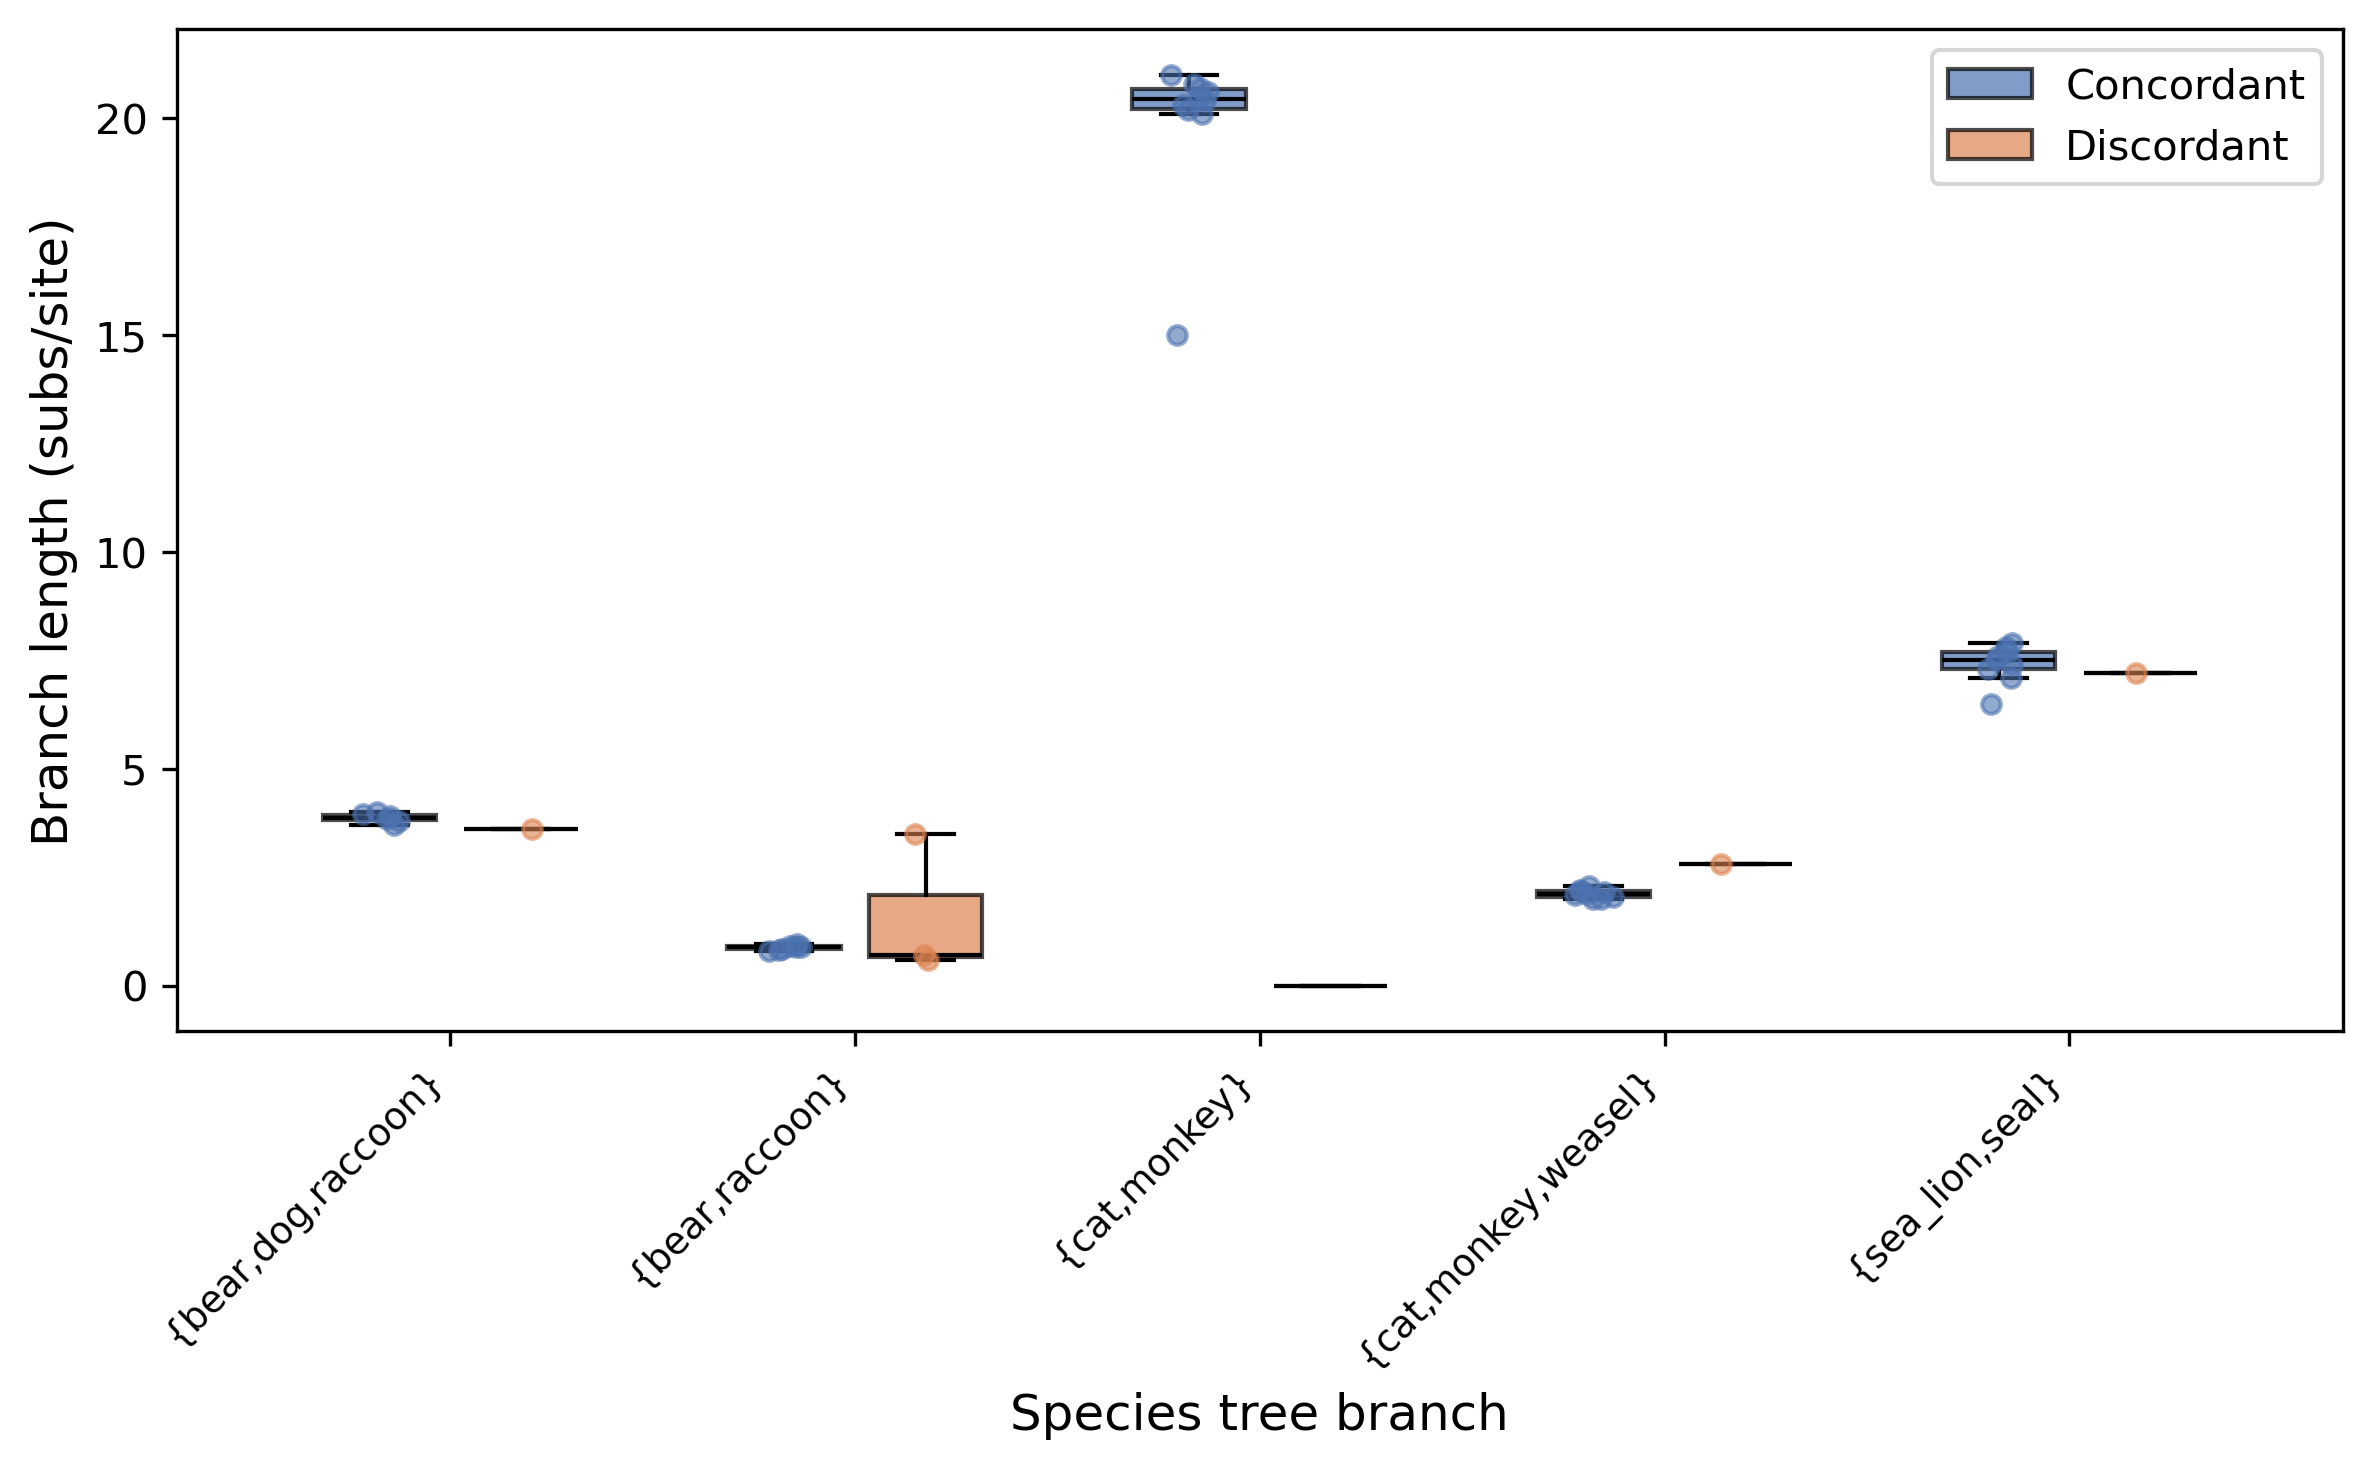
The plot shows grouped box plots with jittered data points for each species tree branch, comparing branch lengths between concordant (blue) and discordant (orange) gene trees. Branches where the FDR-corrected p-value is below 0.05 are marked with an asterisk.