Pairwise identity
Pairwise sequence identity in an alignment
Command identity
- Canonical command:
pairwise_identity- Handler:
pairwise_identity- Aliases:
pairwise_id, pi
- Standalone executables:
pk_pairwise_identity, pk_pairwise_id, pk_pi
- Categories:
Alignment quality & statistics
Runtime interface
Synopsis
phykit pairwise_identity <alignment> [--verbose] [--exclude_gaps] [--plot] [--plot-output <plot_output>] [--fig-width <fig_width>] [--fig-height <fig_height>] [--dpi <dpi>] [--no-title] [--title <title>] [--legend-position <legend_position>] [--ylabel-fontsize <ylabel_fontsize>] [--xlabel-fontsize <xlabel_fontsize>] [--title-fontsize <title_fontsize>] [--axis-fontsize <axis_fontsize>] [--colors <colors>] [--ladderize] [--cladogram] [--circular] [--color-file <color_file>] [--json]
Arguments
This table is generated from the live command parser. It is the authoritative source for accepted spellings, required arguments, types, defaults, and choices.
Argument |
Required |
Type |
Default |
Choices |
|---|---|---|---|---|
|
true |
str |
required |
any |
|
false |
boolean |
false |
any |
|
false |
boolean |
false |
any |
|
false |
boolean |
false |
any |
|
false |
str |
pairwise_identity_heatmap.png |
any |
|
false |
float |
none |
any |
|
false |
float |
none |
any |
|
false |
int |
300 |
any |
|
false |
boolean |
false |
any |
|
false |
str |
none |
any |
|
false |
str |
none |
any |
|
false |
float |
none |
any |
|
false |
float |
none |
any |
|
false |
float |
none |
any |
|
false |
float |
none |
any |
|
false |
str |
none |
any |
|
false |
boolean |
false |
any |
|
false |
boolean |
false |
any |
|
false |
boolean |
false |
any |
|
false |
str |
none |
any |
|
false |
boolean |
false |
any |
Output and errors
--json provides the command's structured JSON representation. Output-file options: --plot-output. Invalid command syntax exits with status 2. Input
validation and scientific limitations are described in the guidance below.
Guidance, interpretation, and examples
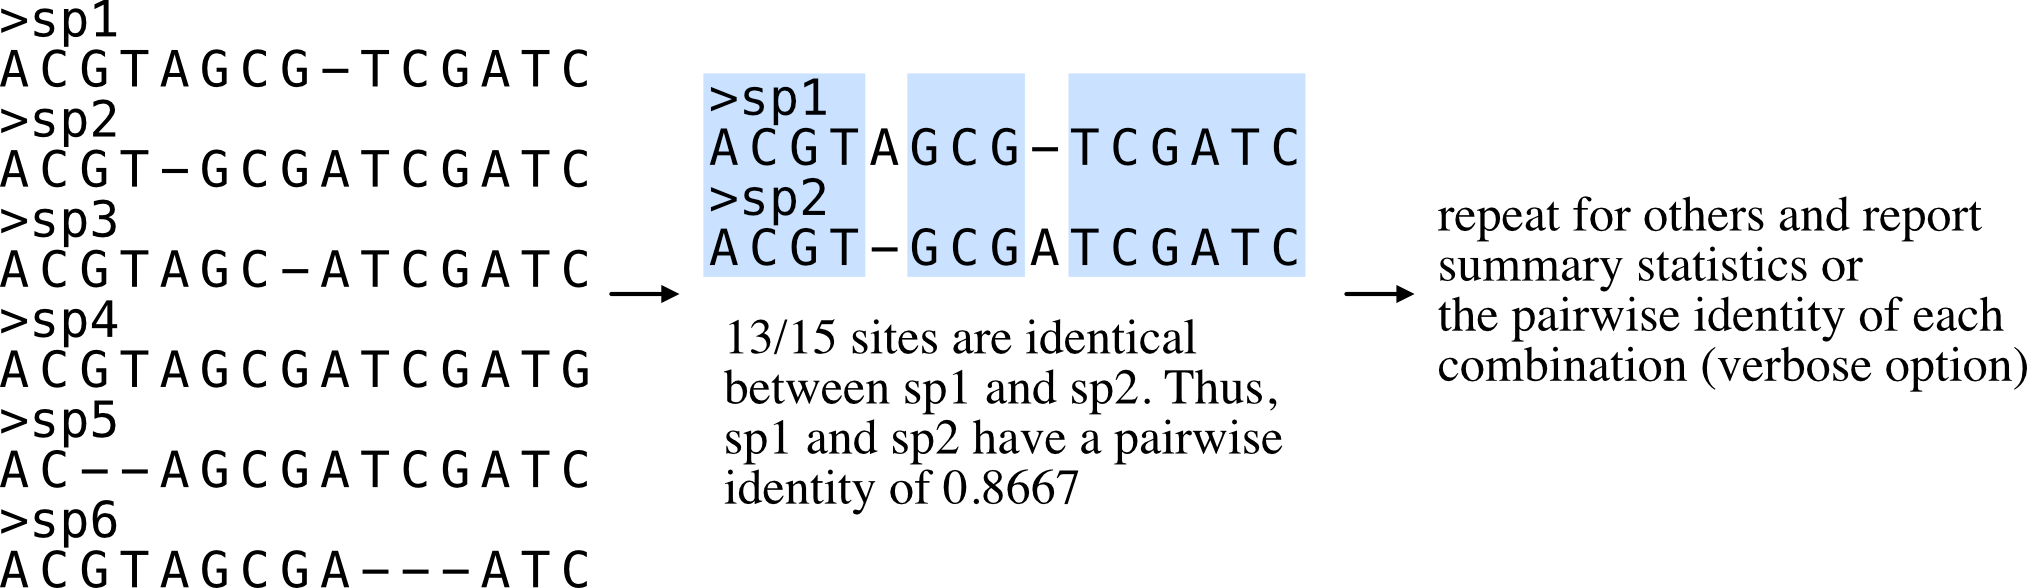
Calculate the average pairwise identity among sequences.
Pairwise identities can be used as proxies for the evolutionary rate of sequences.
Pairwise identity is defined as the number of identical columns (including gaps) between two aligned sequences divided by the number of columns in the alignment. Summary statistics are reported unless used with the verbose option in which all pairwise identities will be reported.
An example of pairwise identities being used as a proxy for evolutionary rate can be found here: Chen et al. Genome Biology and Evolution (2017), doi: 10.1093/gbe/evx147.
phykit pairwise_identity <alignment> [-v/--verbose] [-e/--exclude_gaps] [--plot] [--plot-output <file>]
        [--fig-width <float>] [--fig-height <float>] [--dpi <int>] [--no-title] [--title <str>]
        [--legend-position <str>] [--ylabel-fontsize <float>] [--xlabel-fontsize <float>]
        [--title-fontsize <float>] [--axis-fontsize <float>] [--colors <str>] [--ladderize] [--cladogram] [--circular] [--color-file <file>] [--json]
Options:
<alignment>: first argument after function name should be an alignment file
-v/--verbose: optional argument to print identity per pair
-e/--exclude_gaps: if a site has a gap, ignore it
--plot: save a clustered pairwise-identity heatmap
--plot-output: output path for heatmap (default: pairwise_identity_heatmap.png)
--fig-width: figure width in inches (auto-scaled if omitted)
--fig-height: figure height in inches (auto-scaled if omitted)
--dpi: resolution in DPI (default: 300)
--no-title: hide the plot title
--title: custom title text
--legend-position: legend location (e.g., "upper right", "none" to hide)
--ylabel-fontsize: font size for y-axis labels; 0 to hide
--xlabel-fontsize: font size for x-axis labels; 0 to hide
--title-fontsize: font size for the title
--axis-fontsize: font size for axis labels
--colors: comma-separated colors (hex or named)
--ladderize: ladderize (sort) the tree before plotting
--cladogram: draw cladogram (equal branch lengths, tips aligned) instead of phylogram
--circular: draw circular (radial/fan) phylogram instead of rectangular
--color-file: color annotation file for tip labels, clade ranges, and branch colors (iTOL-inspired TSV format)
--json: optional argument to print results as JSON