Phylogenetic ANOVA / MANOVA
Phylogenetic ANOVA or MANOVA using RRPP (Adams & Collyer 2018)
Command identity
- Canonical command:
phylo_anova- Handler:
phylo_anova- Aliases:
panova, phylo_manova, pmanova
- Standalone executables:
pk_phylo_anova, pk_panova, pk_phylo_manova, pk_pmanova
- Categories:
Phylogenetic comparative methods
Runtime interface
Synopsis
phykit phylo_anova --tree <tree> --traits <traits> [--group-column <group_column>] [--method <method>] [--permutations <permutations>] [--pairwise] [--plot-output <plot_output>] [--plot-type <plot_type>] [--seed <seed>] [--fig-width <fig_width>] [--fig-height <fig_height>] [--dpi <dpi>] [--no-title] [--title <title>] [--legend-position <legend_position>] [--ylabel-fontsize <ylabel_fontsize>] [--xlabel-fontsize <xlabel_fontsize>] [--title-fontsize <title_fontsize>] [--axis-fontsize <axis_fontsize>] [--colors <colors>] [--ladderize] [--cladogram] [--circular] [--color-file <color_file>] [--json]
Arguments
This table is generated from the live command parser. It is the authoritative source for accepted spellings, required arguments, types, defaults, and choices.
Argument |
Required |
Type |
Default |
Choices |
|---|---|---|---|---|
|
true |
str |
required |
any |
|
true |
str |
required |
any |
|
false |
str |
none |
any |
|
false |
str |
auto |
auto, anova, manova |
|
false |
int |
1000 |
any |
|
false |
boolean |
false |
any |
|
false |
str |
none |
any |
|
false |
str |
auto |
auto, boxplot, phylomorphospace |
|
false |
int |
none |
any |
|
false |
float |
none |
any |
|
false |
float |
none |
any |
|
false |
int |
300 |
any |
|
false |
boolean |
false |
any |
|
false |
str |
none |
any |
|
false |
str |
none |
any |
|
false |
float |
none |
any |
|
false |
float |
none |
any |
|
false |
float |
none |
any |
|
false |
float |
none |
any |
|
false |
str |
none |
any |
|
false |
boolean |
false |
any |
|
false |
boolean |
false |
any |
|
false |
boolean |
false |
any |
|
false |
str |
none |
any |
|
false |
boolean |
false |
any |
Output and errors
--json provides the command's structured JSON representation. Output-file options: --plot-output. Invalid command syntax exits with status 2. Input
validation and scientific limitations are described in the guidance below.
Guidance, interpretation, and examples
Phylogenetic ANOVA (univariate) or MANOVA (multivariate) using the Residual Randomization Permutation Procedure (RRPP) of Adams & Collyer (2018). Tests whether a continuous trait or multiple traits differ across discrete groups (e.g., diet, habitat) while accounting for phylogenetic non-independence via the phylogenetic variance-covariance matrix.
The method auto-detects univariate vs multivariate based on the number
of response trait columns. With one response trait, it runs a phylogenetic
ANOVA; with multiple, it runs a phylogenetic MANOVA using Pillai's trace
as the test statistic. Users can override with --method anova or
--method manova.
How it works:
The phylogenetic VCV matrix is Cholesky-decomposed and used to transform the data, removing phylogenetic correlation.
A reduced model (intercept only) and full model (intercept + group) are fit to the transformed data.
The observed F-statistic (ANOVA) or Pillai's trace (MANOVA) is computed.
Residuals of the reduced model are permuted (RRPP) to build a null distribution; the p-value is the proportion of permuted statistics >= the observed statistic.
A Z-score (effect size) is also reported.
Interpreting the output:
The ANOVA table shows:
SS (Sum of Squares): variance attributed to the grouping factor vs residuals.
MS (Mean Squares): SS / Df.
F: ratio of MS_model to MS_residual. Larger F means greater group separation relative to within-group variation.
Z: standardized effect size — how many standard deviations the observed F is from the null mean. Z > 2 generally indicates strong signal.
p-value: proportion of permuted F values >= observed. Small p (e.g., < 0.05) suggests groups differ significantly after accounting for phylogeny.
Pillai's trace (MANOVA only): ranges from 0 to the number of response traits. Higher values indicate stronger multivariate group separation.
A non-significant result (large p-value) means that after accounting for shared ancestry, the groups do not differ more than expected by chance. This is common when closely related species share similar trait values regardless of group assignment.
Pairwise comparisons (--pairwise): for each pair of groups,
computes the Euclidean distance between group means in phylogenetically
transformed space, with permutation-based p-values.
Example (ANOVA):
phykit phylo_anova -t species.tre --traits trait_data.tsv --permutations 999
Example output:
Phylogenetic ANOVA (RRPP, 999 permutations)
Response: body_mass
Groups (3): carnivore, herbivore, omnivore
N taxa: 8

Source             Df           SS           MS          F          Z    p-value
----------------------------------------------------------------------------
group               2       0.0382       0.0191     0.3548    -0.7213     0.8088
residuals           5       0.2691       0.0538
total               7       0.3073
In this example, p = 0.81 and Z = -0.72 indicate no significant difference in body mass among diet groups after accounting for phylogeny.
Example (MANOVA with pairwise):
phykit phylo_manova -t species.tre --traits multi_traits.tsv --pairwise --permutations 999
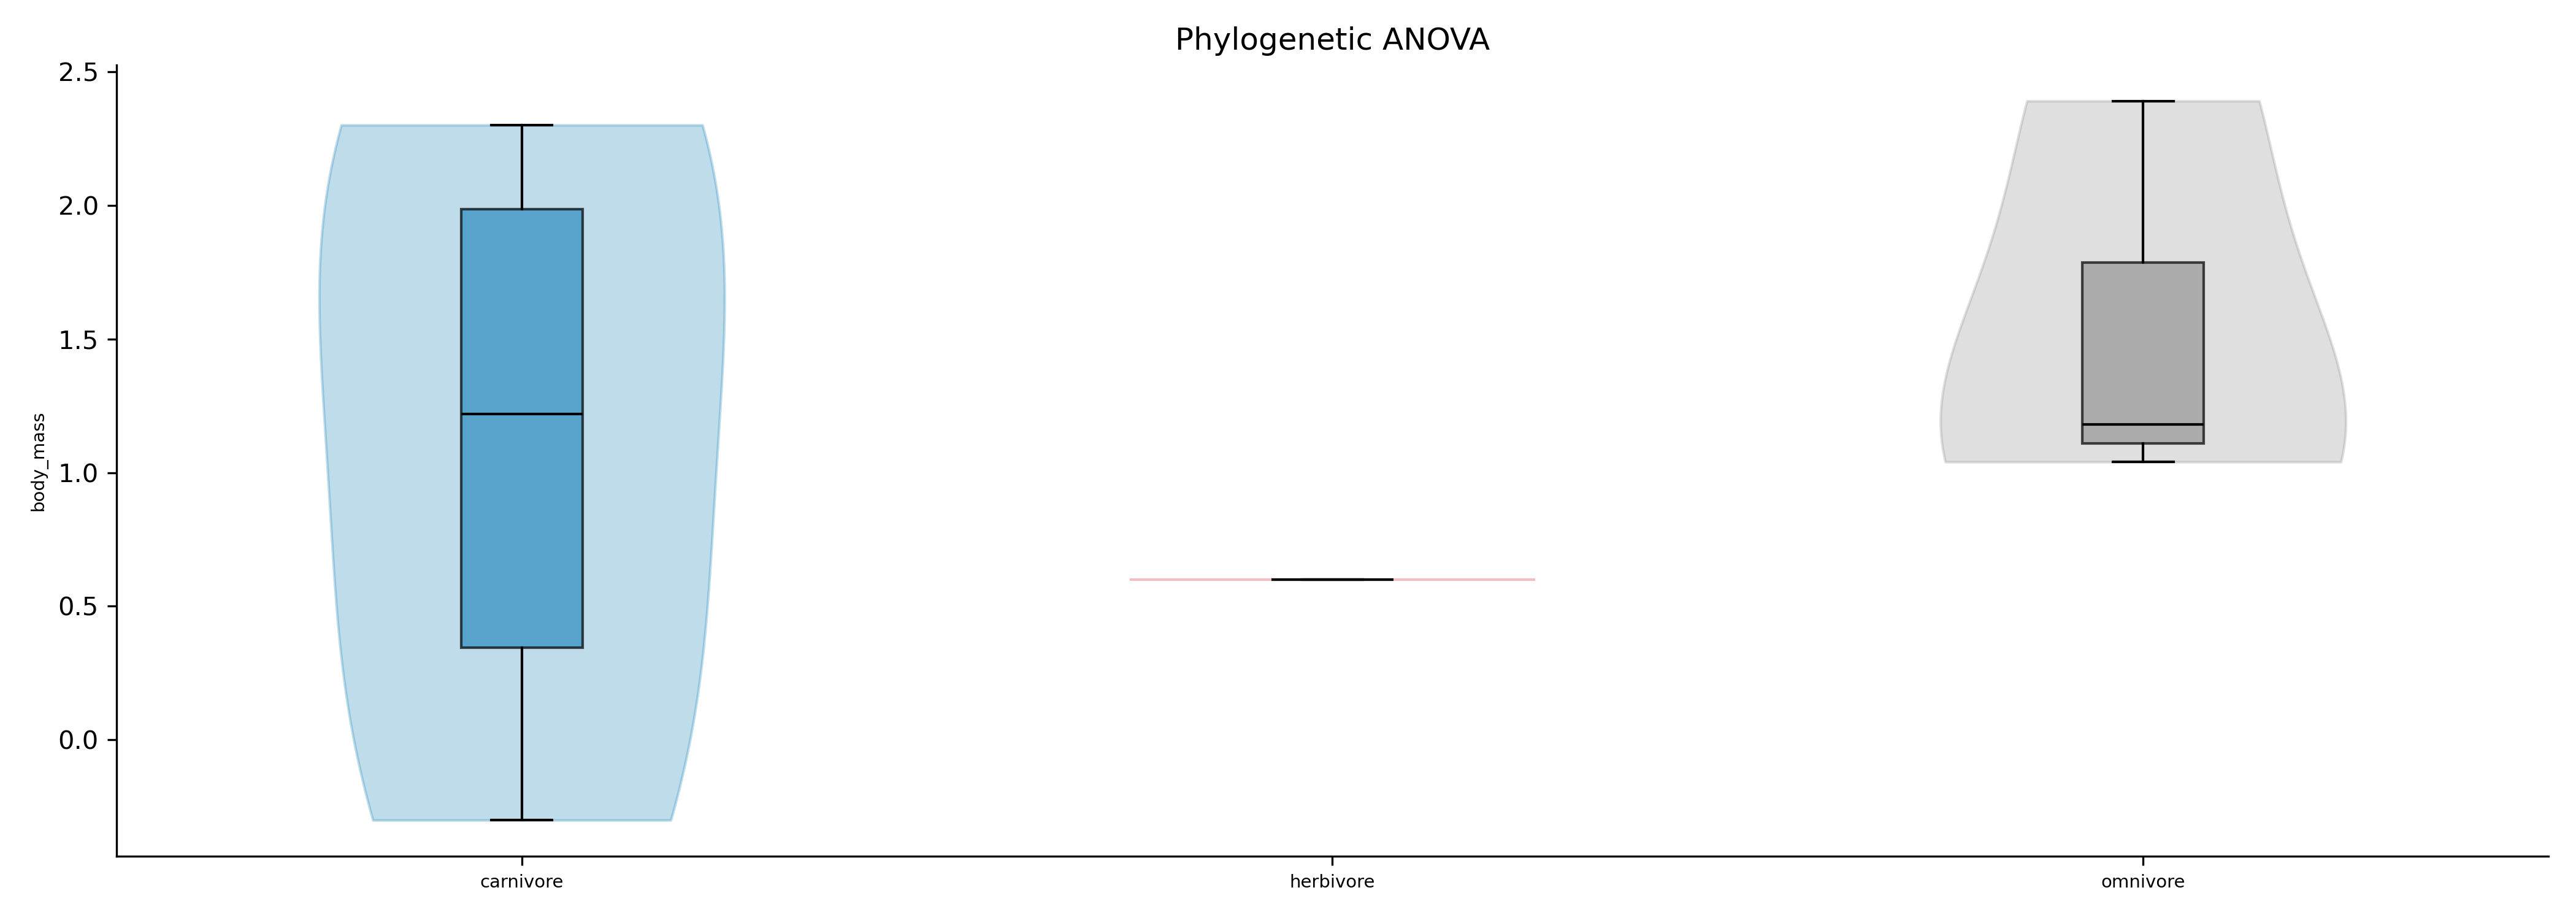
Violin + boxplot showing trait values by group for phylogenetic ANOVA.
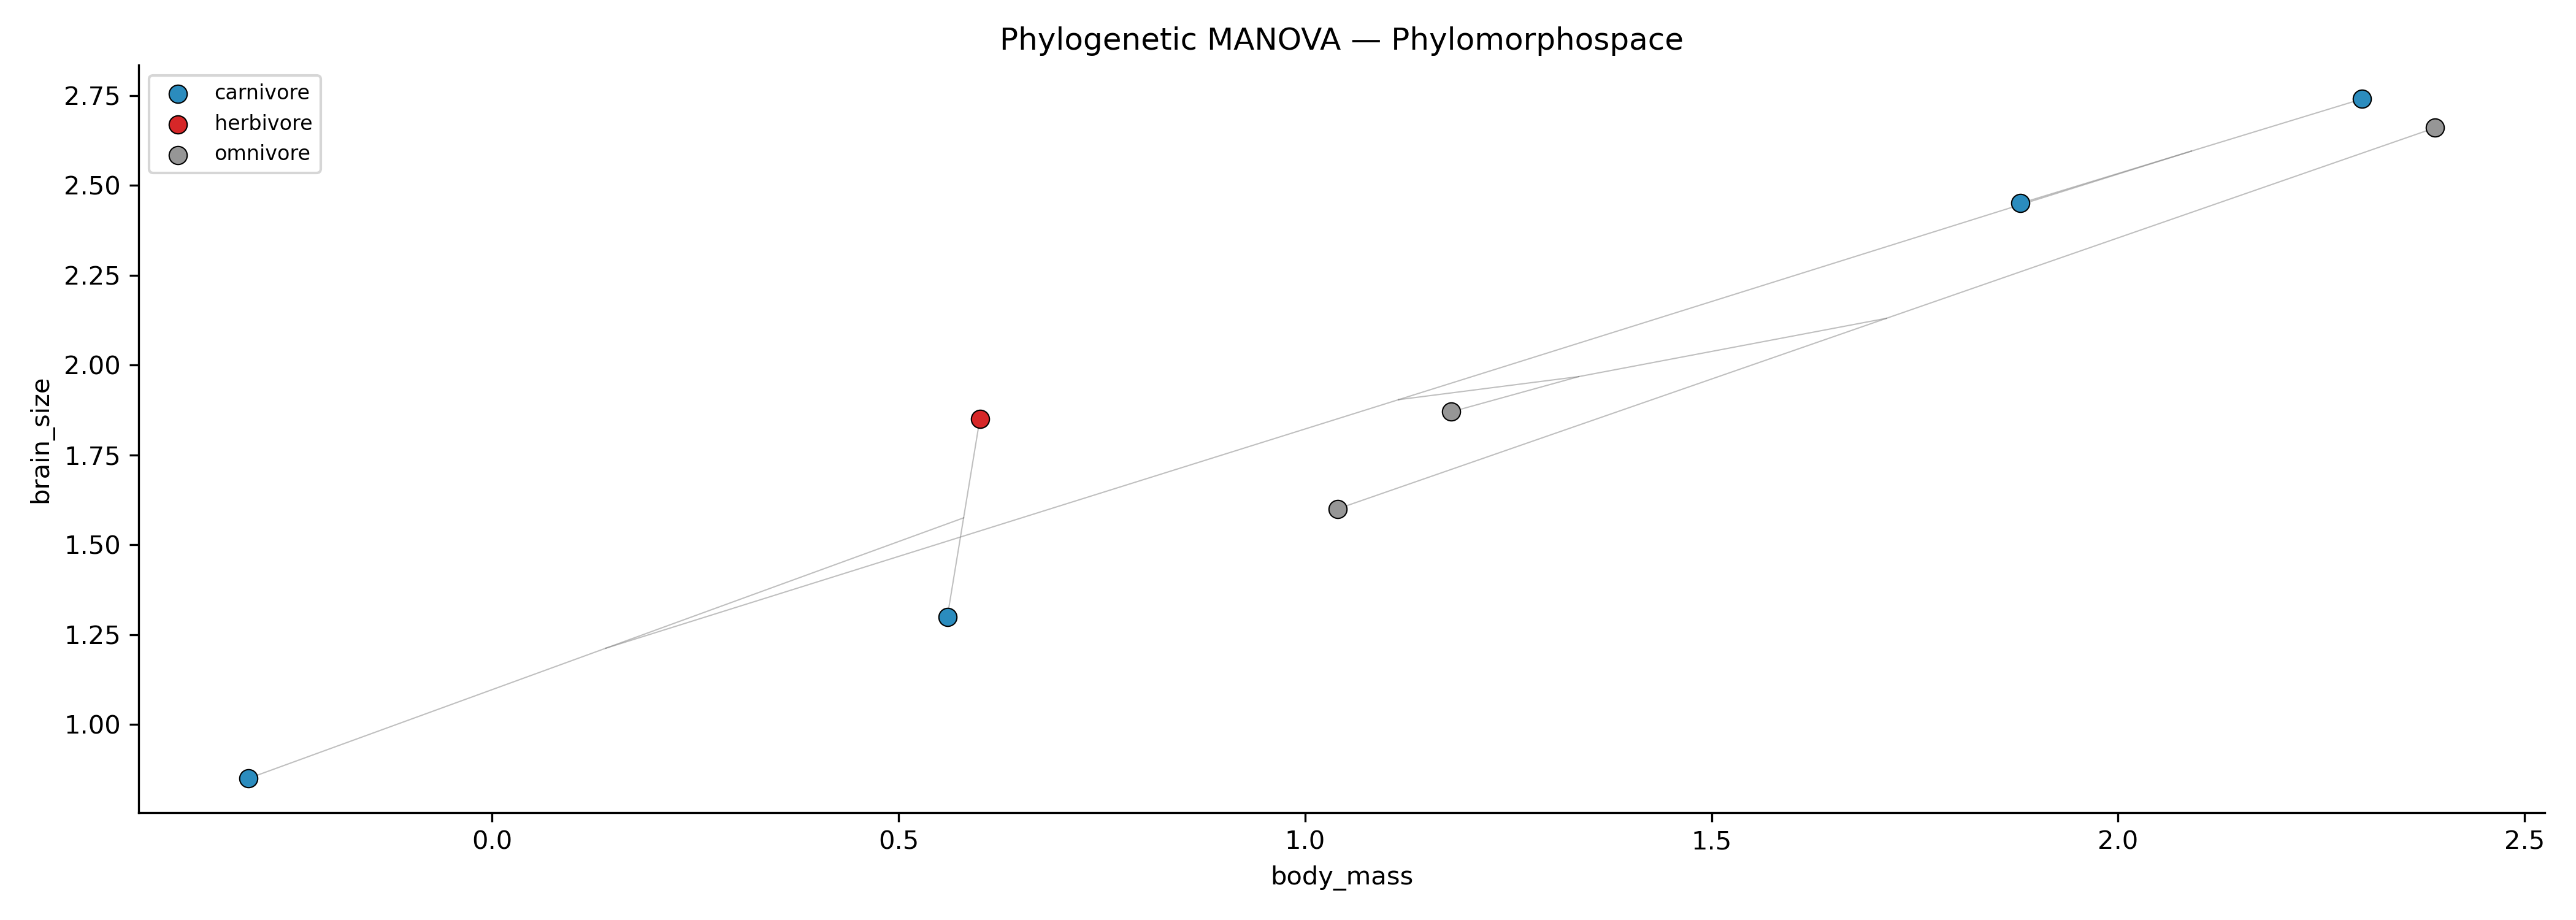
Phylomorphospace colored by group for phylogenetic MANOVA. Points represent species, edges represent phylogenetic relationships, and colors correspond to group membership.
phykit phylo_anova -t <tree> --traits <traits_file>
    [--group-column <name>] [--method auto|anova|manova]
    [--permutations <int>] [--pairwise]
    [--plot-output <file>] [--plot-type boxplot|phylomorphospace]
    [--seed <int>] [--json]
Options:
-t/--tree: species tree file (required)
--traits: TSV file with taxon, group column, and one or more response trait columns (required)
--group-column: name of the categorical grouping column (default: first non-taxon column)
--method: auto, anova, or manova (default: auto — detects from number of response columns)
--permutations: number of RRPP permutations (default: 1000)
--pairwise: include post-hoc pairwise group comparisons
--plot-output: output figure path (.png, .pdf, .svg)
--plot-type: boxplot (violin+boxplot for ANOVA) or phylomorphospace (for MANOVA); default: auto-detected
--seed: random seed for reproducible permutations
--json: output results as JSON
R validation: Deterministic components (SS, MS, F, Pillai's trace)
have been validated against manual Cholesky-transformed ANOVA/MANOVA
in R using ape::vcv() for the phylogenetic covariance matrix
(see tests/r_validation/validate_phylo_anova.R).