Ancestral state reconstruction
Reconstruct ancestral character states
Command identity
- Canonical command:
ancestral_state_reconstruction- Handler:
ancestral_state_reconstruction- Aliases:
anc_recon, asr
- Standalone executables:
pk_ancestral_state_reconstruction, pk_anc_recon, pk_asr
- Categories:
Trait evolution
Runtime interface
Synopsis
phykit ancestral_state_reconstruction --tree <tree> --trait_data <trait_data> [--trait <trait>] [--type <type>] [--method <method>] [--model <model>] [--ci] [--plot <plot>] [--plot-ci] [--ci-size <ci_size>] [--fig-width <fig_width>] [--fig-height <fig_height>] [--dpi <dpi>] [--no-title] [--title <title>] [--legend-position <legend_position>] [--ylabel-fontsize <ylabel_fontsize>] [--xlabel-fontsize <xlabel_fontsize>] [--title-fontsize <title_fontsize>] [--axis-fontsize <axis_fontsize>] [--colors <colors>] [--ladderize] [--cladogram] [--circular] [--color-file <color_file>] [--json]
Arguments
This table is generated from the live command parser. It is the authoritative source for accepted spellings, required arguments, types, defaults, and choices.
Argument |
Required |
Type |
Default |
Choices |
|---|---|---|---|---|
|
true |
str |
required |
any |
|
true |
str |
required |
any |
|
false |
str |
none |
any |
|
false |
str |
continuous |
continuous, discrete |
|
false |
str |
fast |
fast, ml |
|
false |
str |
ER |
ER, SYM, ARD |
|
false |
boolean |
false |
any |
|
false |
str |
none |
any |
|
false |
boolean |
false |
any |
|
false |
float |
1.0 |
any |
|
false |
float |
none |
any |
|
false |
float |
none |
any |
|
false |
int |
300 |
any |
|
false |
boolean |
false |
any |
|
false |
str |
none |
any |
|
false |
str |
none |
any |
|
false |
float |
none |
any |
|
false |
float |
none |
any |
|
false |
float |
none |
any |
|
false |
float |
none |
any |
|
false |
str |
none |
any |
|
false |
boolean |
false |
any |
|
false |
boolean |
false |
any |
|
false |
boolean |
false |
any |
|
false |
str |
none |
any |
|
false |
boolean |
false |
any |
Output and errors
--json provides the command's structured JSON representation. Unless the guidance below states otherwise, results are emitted as command output. Invalid command syntax exits with status 2. Input
validation and scientific limitations are described in the guidance below.
Guidance, interpretation, and examples
Estimate ancestral states using maximum likelihood. Supports both continuous and discrete traits.
Continuous traits (--type continuous, default): Brownian Motion
model, analogous to R's phytools::fastAnc() and
ape::ace(type="ML"). Optionally produce a contMap plot.
Two methods are available for continuous traits:
fast (default): Felsenstein's pruning/contrasts shortcut, O(n) time
ml: full VCV-based ML with exact conditional CIs, O(n^3)
Both methods produce identical point estimates; ml gives exact
conditional confidence intervals.
Discrete traits (--type discrete): Mk model with marginal
posterior probabilities at each internal node, analogous to
ape::ace(type="discrete"). Optionally produce a pie-chart phylogeny
plot.
Three models are available for discrete traits:
ER (default): equal rates
SYM: symmetric rates
ARD: all rates different
Input trait data can be either a two-column file (taxon<tab>value)
when -c is omitted, or a multi-trait file with header row when -c
specifies which column to use.
phykit ancestral_state_reconstruction -t <tree> -d <trait_data> [-c <trait>] [--type <type>] [-m <method>] [--model <model>] [--ci] [--plot <output>]
    [--fig-width <float>] [--fig-height <float>] [--dpi <int>] [--no-title] [--title <str>]
    [--legend-position <str>] [--ylabel-fontsize <float>] [--xlabel-fontsize <float>]
    [--title-fontsize <float>] [--axis-fontsize <float>] [--colors <str>] [--ladderize] [--cladogram] [--circular] [--color-file <file>] [--json]
Options:
-t/--tree: a phylogenetic tree file
-d/--trait_data: trait data file (two-column or multi-trait with header)
-c/--trait: trait column name (required for multi-trait files)
--type: trait type: continuous or discrete (default: continuous)
-m/--method: method to use: fast or ml (continuous only; default: fast)
--model: Mk model: ER, SYM, or ARD (discrete only; default: ER)
--ci: include 95% confidence intervals (continuous only)
--plot: output path for plot (requires matplotlib)
--plot-ci: draw confidence interval bars at internal nodes on the contMap plot (requires --ci and --plot)
--ci-size: scale factor for CI bar size (default: 1.0; use 2.0 for larger, 0.5 for smaller)
--fig-width: figure width in inches (auto-scaled if omitted)
--fig-height: figure height in inches (auto-scaled if omitted)
--dpi: resolution in DPI (default: 300)
--no-title: hide the plot title
--title: custom title text
--legend-position: legend location (e.g., "upper right", "none" to hide)
--ylabel-fontsize: font size for y-axis labels; 0 to hide
--xlabel-fontsize: font size for x-axis labels; 0 to hide
--title-fontsize: font size for the title
--axis-fontsize: font size for axis labels
--colors: comma-separated colors (hex or named)
--ladderize: ladderize (sort) the tree before plotting
--cladogram: draw cladogram (equal branch lengths, tips aligned) instead of phylogram
--circular: draw circular (radial/fan) phylogram instead of rectangular
--color-file: color annotation file for tip labels, clade ranges, and branch colors (iTOL-inspired TSV format)
--json: output results as JSON
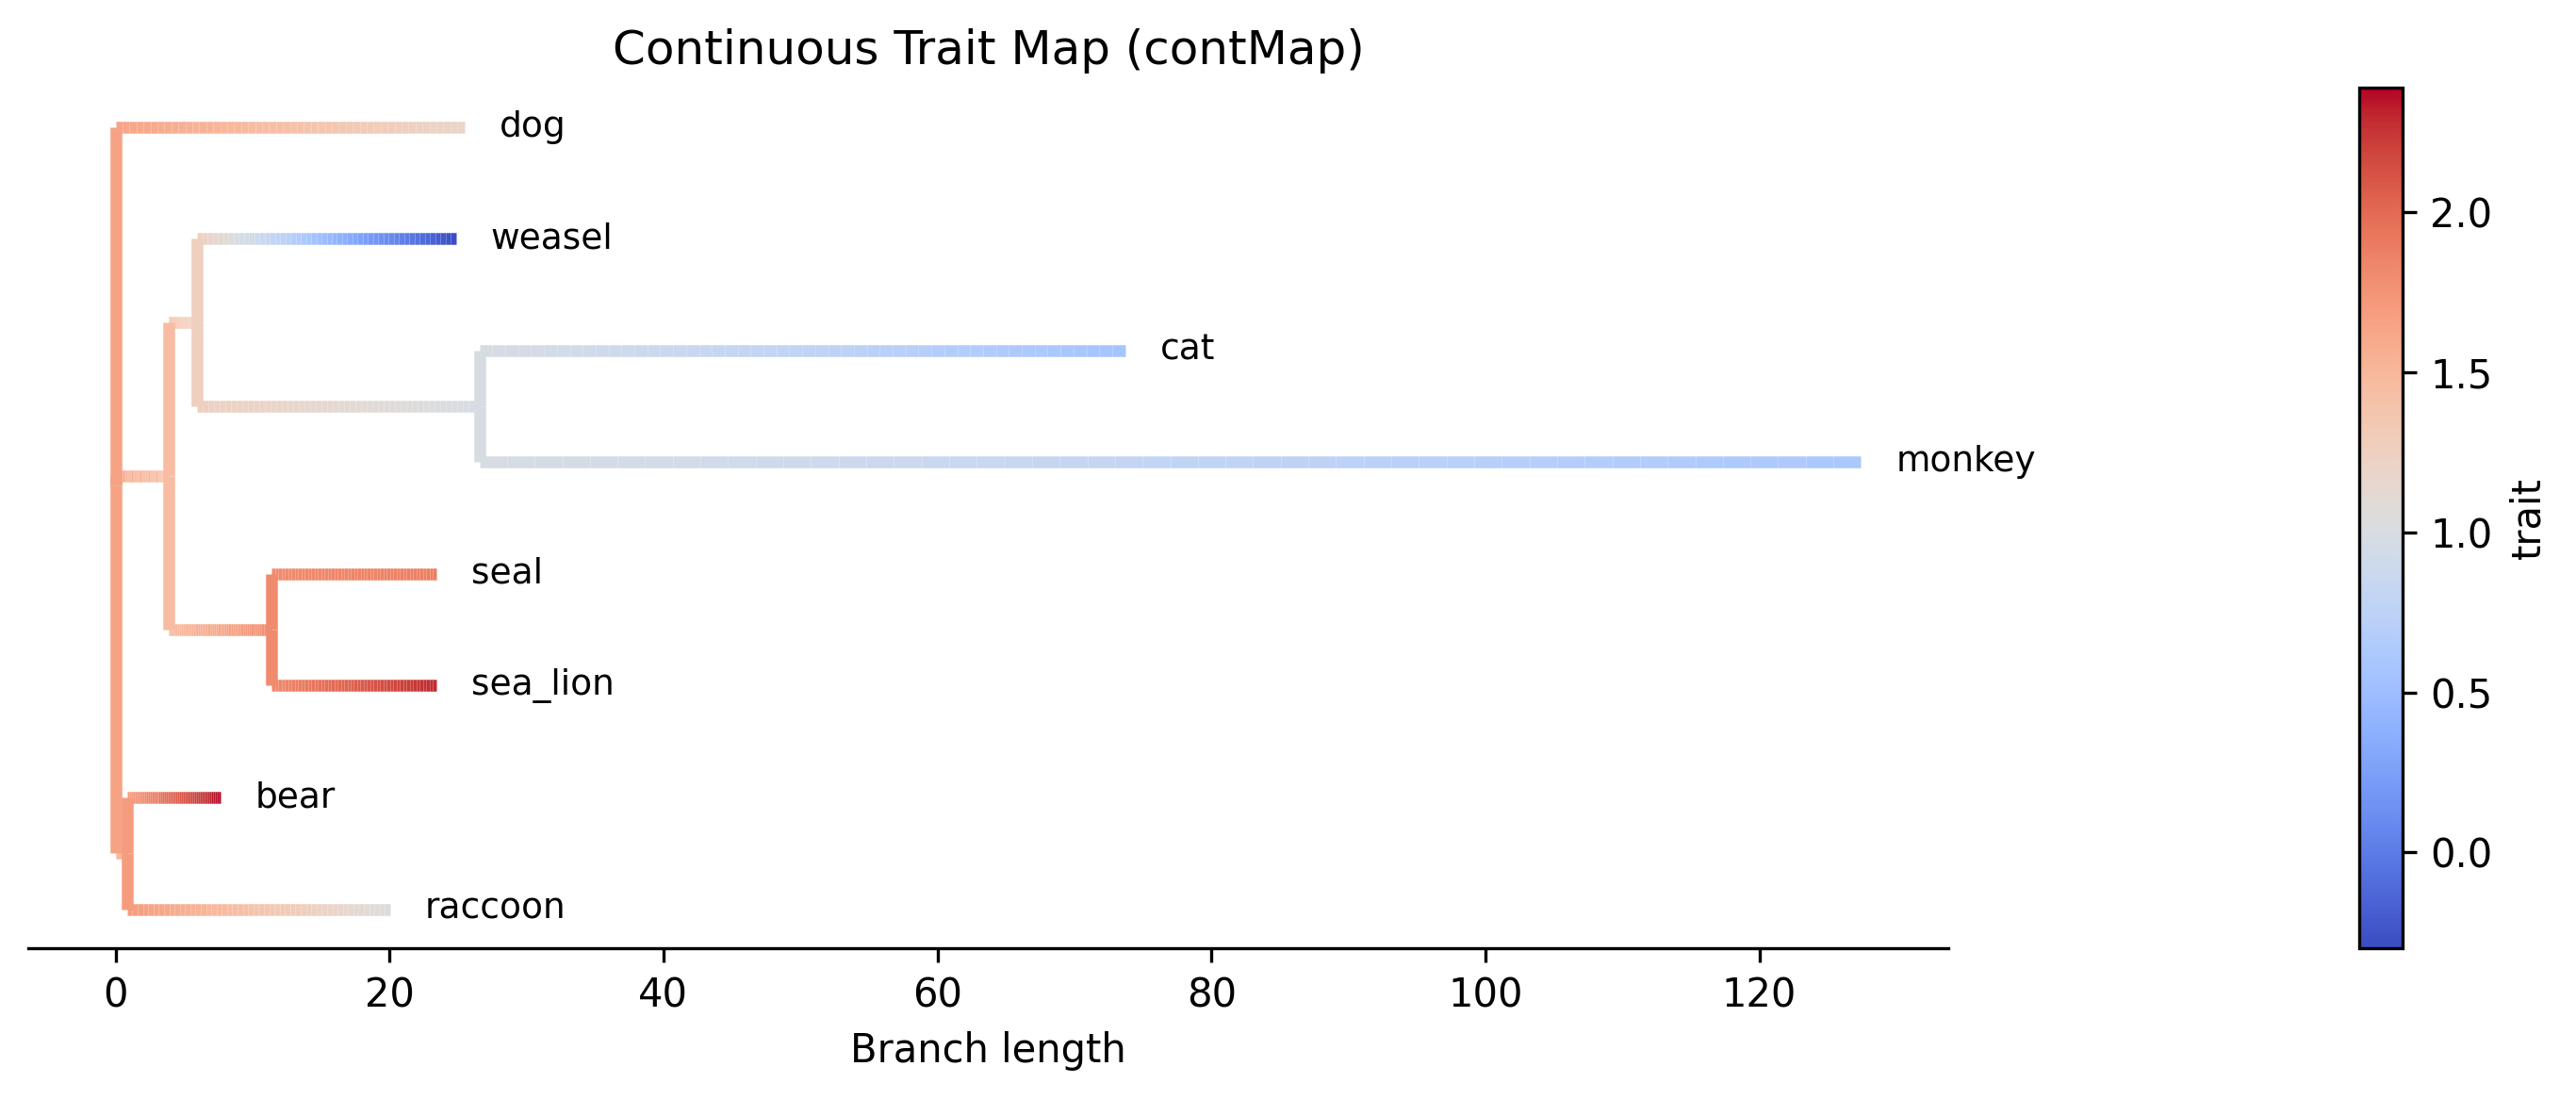
Example contMap plot generated with the --plot option. Branches are colored
by interpolated ancestral trait values: