SIMMAP summary
Per-branch SIMMAP summary with node posteriors (describe.simmap)
Command identity
- Canonical command:
simmap_summary- Handler:
simmap_summary- Aliases:
describe_simmap, smsummary
- Standalone executables:
pk_simmap_summary, pk_describe_simmap, pk_smsummary
- Categories:
Trait evolution
Runtime interface
Synopsis
phykit simmap_summary --tree <tree> --trait_data <trait_data> --trait <trait> [--model <model>] [--nsim <nsim>] [--seed <seed>] [--plot <plot>] [--csv <csv>] [--fig-width <fig_width>] [--fig-height <fig_height>] [--dpi <dpi>] [--no-title] [--title <title>] [--legend-position <legend_position>] [--ylabel-fontsize <ylabel_fontsize>] [--xlabel-fontsize <xlabel_fontsize>] [--title-fontsize <title_fontsize>] [--axis-fontsize <axis_fontsize>] [--colors <colors>] [--ladderize] [--cladogram] [--circular] [--color-file <color_file>] [--json]
Arguments
This table is generated from the live command parser. It is the authoritative source for accepted spellings, required arguments, types, defaults, and choices.
Argument |
Required |
Type |
Default |
Choices |
|---|---|---|---|---|
|
true |
str |
required |
any |
|
true |
str |
required |
any |
|
true |
str |
required |
any |
|
false |
str |
ER |
any |
|
false |
int |
100 |
any |
|
false |
int |
none |
any |
|
false |
str |
none |
any |
|
false |
str |
none |
any |
|
false |
float |
none |
any |
|
false |
float |
none |
any |
|
false |
int |
300 |
any |
|
false |
boolean |
false |
any |
|
false |
str |
none |
any |
|
false |
str |
none |
any |
|
false |
float |
none |
any |
|
false |
float |
none |
any |
|
false |
float |
none |
any |
|
false |
float |
none |
any |
|
false |
str |
none |
any |
|
false |
boolean |
false |
any |
|
false |
boolean |
false |
any |
|
false |
boolean |
false |
any |
|
false |
str |
none |
any |
|
false |
boolean |
false |
any |
Output and errors
--json provides the command's structured JSON representation. Unless the guidance below states otherwise, results are emitted as command output. Invalid command syntax exits with status 2. Input
validation and scientific limitations are described in the guidance below.
Guidance, interpretation, and examples
Run N stochastic character maps (SIMMAP) and summarize the results
per branch, analogous to phytools::describe.simmap() in R.
For each branch, reports:
Dwelling time proportions: the average fraction of time spent in each character state across all simulations
Expected transitions: the mean number of state changes on that branch
For each internal node, reports:
Posterior probabilities: the proportion of simulations in which each state was sampled at that node
Interpreting the output:
A branch with dwelling proportions
carnivore=0.72, herbivore=0.17,
omnivore=0.11
spent 72% of its evolutionary time in the carnivore state (averaged across N maps). This indicates high confidence the lineage was carnivorous along that branch.A node with posteriors
carnivore=0.56, herbivore=0.25, omnivore=0.19was reconstructed as carnivore in 56% of simulations. Low values across all states indicate genuine ancestral uncertainty.E[trans]is the expected number of state changes on each branch. High values on long branches are expected. Values > 1 on short branches suggest rapid trait evolution.
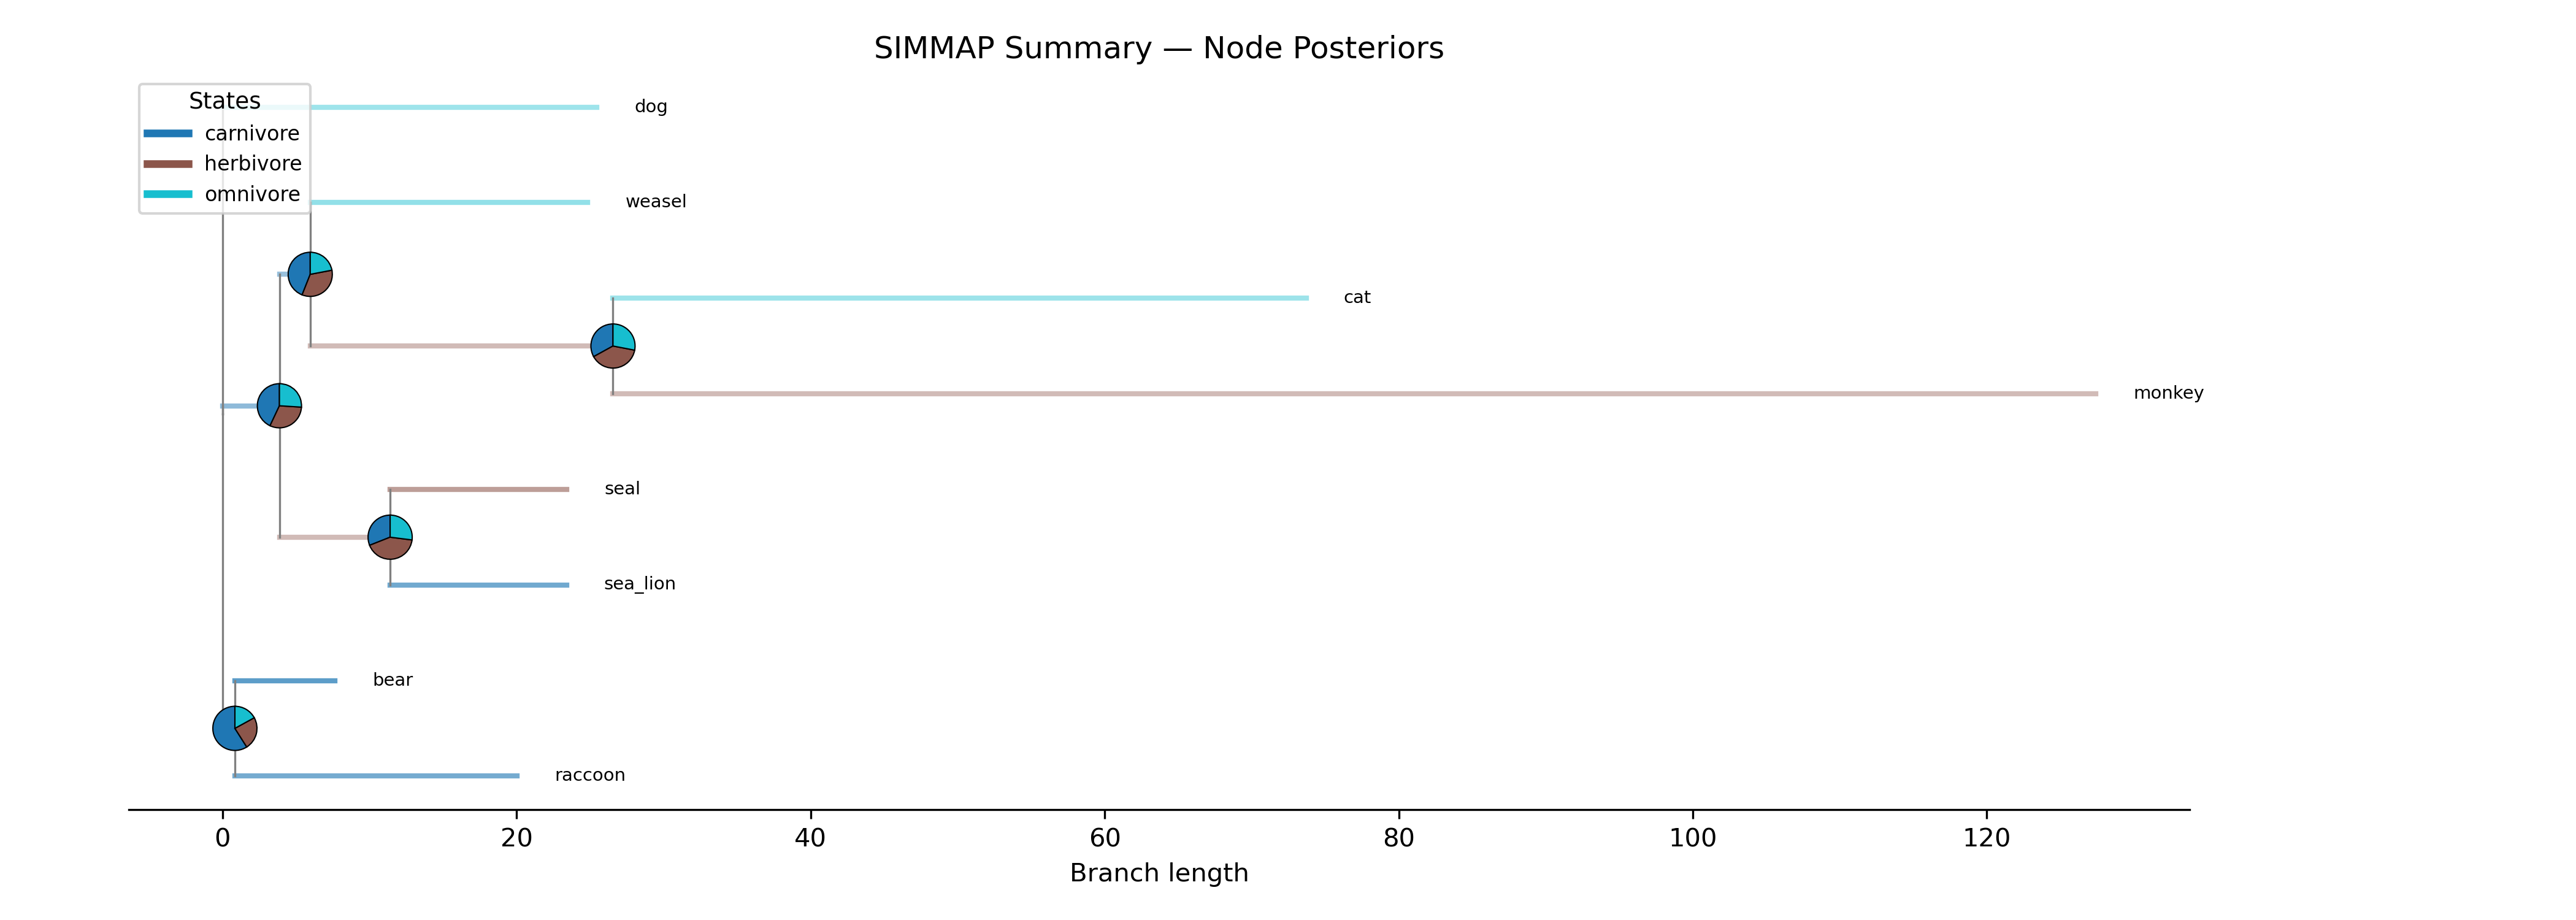
Tree with pie charts at internal nodes showing posterior state probabilities from 100 stochastic maps. Branches colored by the dominant state.
phykit simmap_summary -t <tree> -d <trait_data> -c <trait>
    [-m/--model ER|SYM|ARD] [-n/--nsim <int>]
    [--seed <int>] [--plot <file>] [--csv <file>] [--json]
Options:
-t/--tree: phylogenetic tree file (required)
-d/--trait_data: tab-delimited trait file with header row (required)
-c/--trait: column name for the discrete character trait (required)
-m/--model: substitution model — ER (equal rates, default), SYM (symmetric), or ARD (all rates different)
-n/--nsim: number of stochastic maps to simulate (default: 100)
--seed: random seed for reproducibility
--plot: output plot file showing tree with posterior pie charts at nodes (.png, .pdf, .svg)
--csv: output CSV file with per-branch dwelling proportions and node posteriors
--json: output results as JSON
R validation: Q matrix and log-likelihood validated against
phytools::fitMk() and phytools::make.simmap()
(see tests/r_validation/validate_simmap_summary.R).