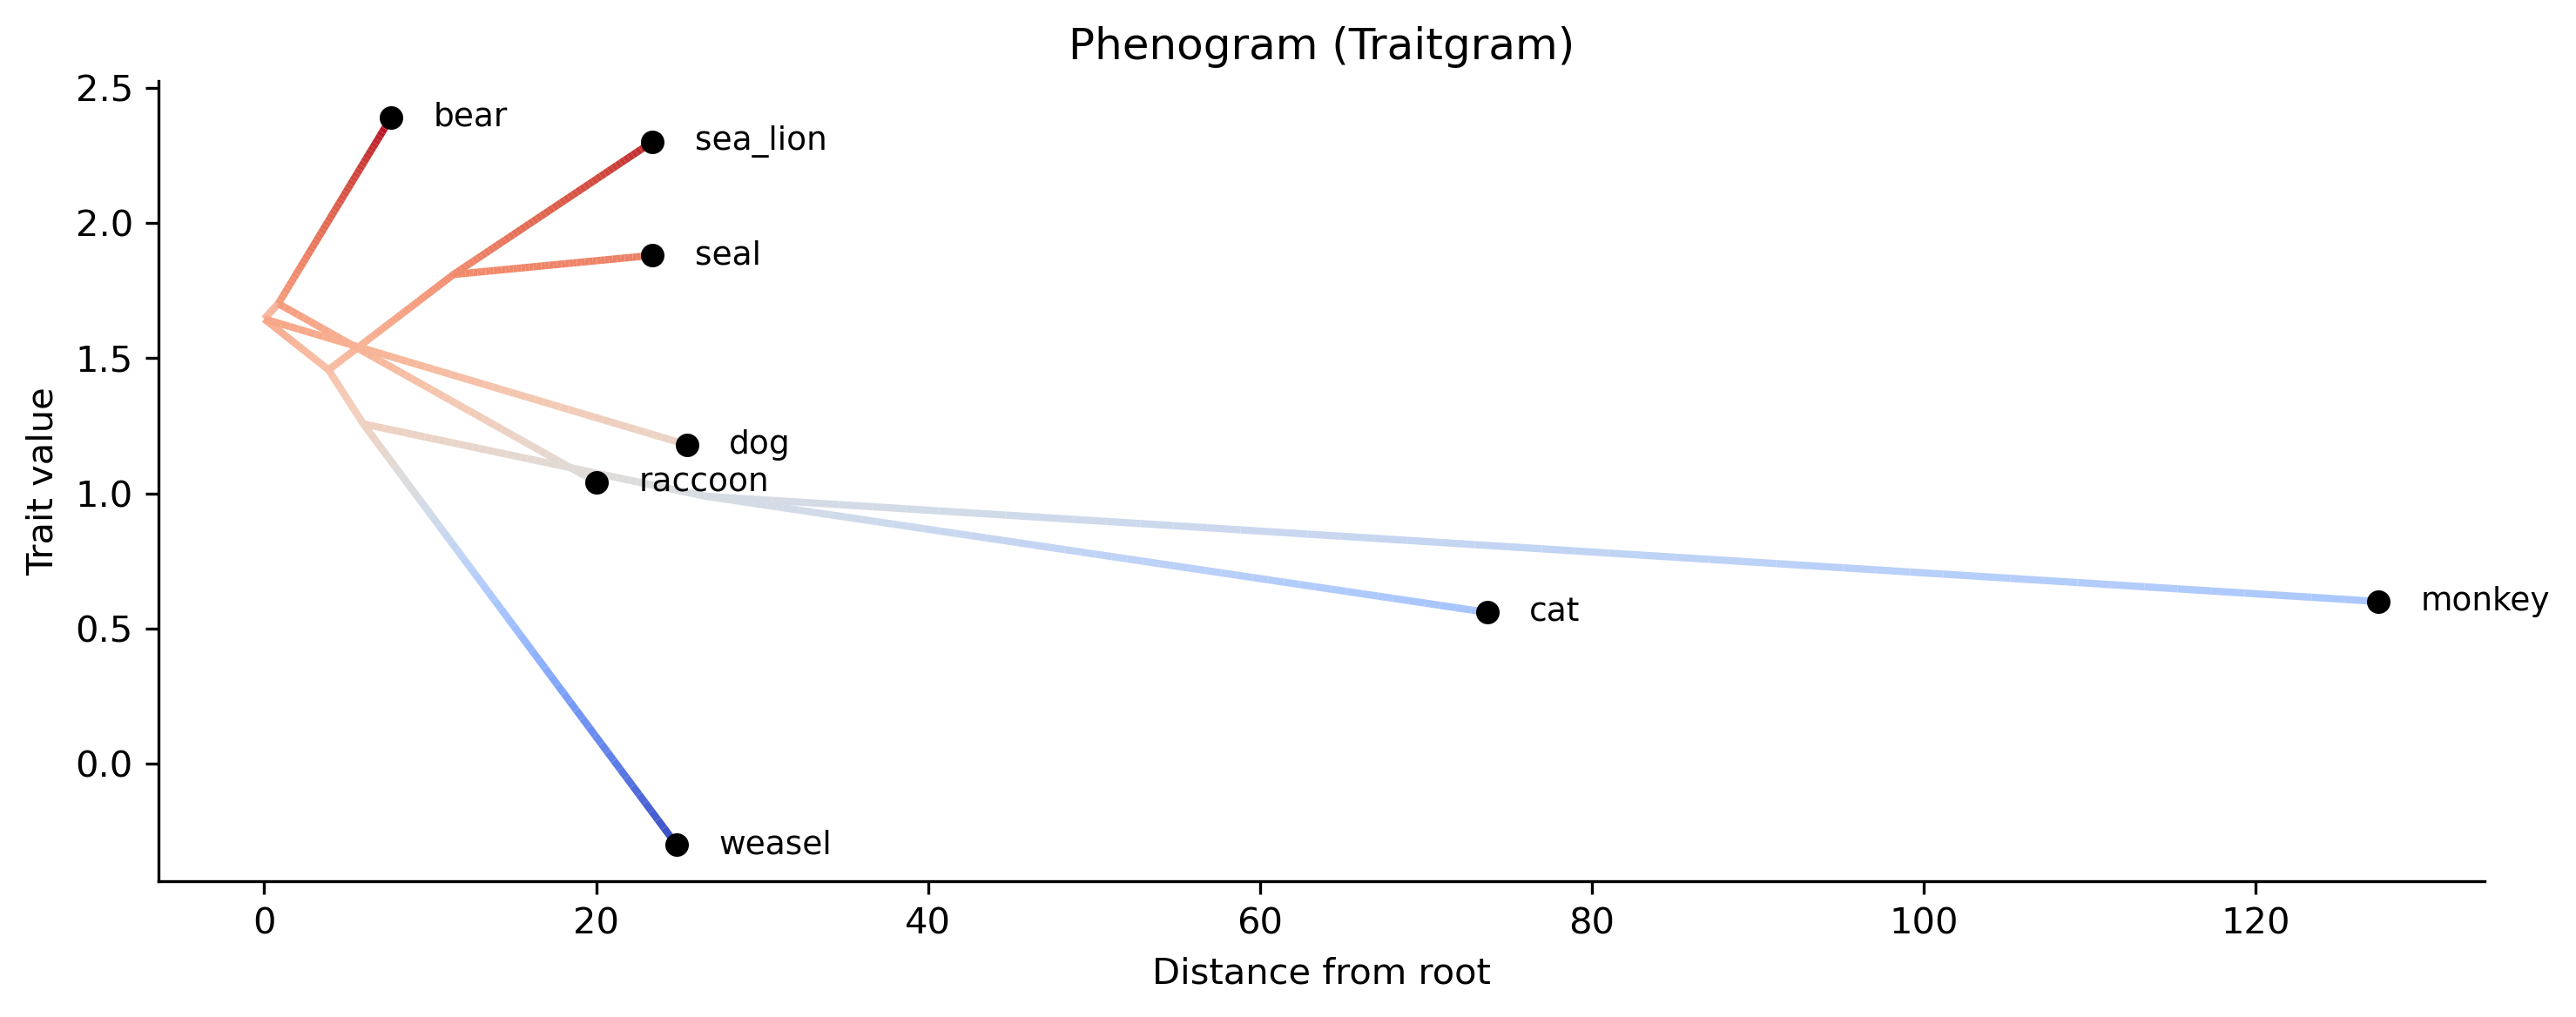
Phenogram (traitgram)
Phenogram visualizing trait evolution
Command identity
- Canonical command:
phenogram- Handler:
phenogram- Aliases:
tg, traitgram
- Standalone executables:
pk_phenogram, pk_tg, pk_traitgram
- Categories:
Trait evolution
Runtime interface
Synopsis
phykit phenogram --tree <tree> --trait_data <trait_data> --output <output> [--fig-width <fig_width>] [--fig-height <fig_height>] [--dpi <dpi>] [--no-title] [--title <title>] [--legend-position <legend_position>] [--ylabel-fontsize <ylabel_fontsize>] [--xlabel-fontsize <xlabel_fontsize>] [--title-fontsize <title_fontsize>] [--axis-fontsize <axis_fontsize>] [--colors <colors>] [--ladderize] [--cladogram] [--circular] [--color-file <color_file>] [--json]
Arguments
This table is generated from the live command parser. It is the authoritative source for accepted spellings, required arguments, types, defaults, and choices.
Argument |
Required |
Type |
Default |
Choices |
|---|---|---|---|---|
|
true |
str |
required |
any |
|
true |
str |
required |
any |
|
true |
str |
required |
any |
|
false |
float |
none |
any |
|
false |
float |
none |
any |
|
false |
int |
300 |
any |
|
false |
boolean |
false |
any |
|
false |
str |
none |
any |
|
false |
str |
none |
any |
|
false |
float |
none |
any |
|
false |
float |
none |
any |
|
false |
float |
none |
any |
|
false |
float |
none |
any |
|
false |
str |
none |
any |
|
false |
boolean |
false |
any |
|
false |
boolean |
false |
any |
|
false |
boolean |
false |
any |
|
false |
str |
none |
any |
|
false |
boolean |
false |
any |
Output and errors
--json provides the command's structured JSON representation. Output-file options: --output. Invalid command syntax exits with status 2. Input
validation and scientific limitations are described in the guidance below.
Guidance, interpretation, and examples
Plot a phenogram (traitgram) showing trait evolution along a phylogeny
(analogous to R's phytools::phenogram()). The X-axis represents
distance from the root and the Y-axis represents trait values.
Ancestral states are reconstructed via maximum-likelihood.
phykit phenogram -t <tree> -d <trait_data> -o <output.png>
    [--fig-width <float>] [--fig-height <float>] [--dpi <int>] [--no-title] [--title <str>]
    [--legend-position <str>] [--ylabel-fontsize <float>] [--xlabel-fontsize <float>]
    [--title-fontsize <float>] [--axis-fontsize <float>] [--colors <str>] [--ladderize] [--cladogram] [--circular] [--color-file <file>] [--json]
Options:
-t/--tree: a tree file in Newick format
-d/--trait_data: tab-delimited trait file (taxon<tab>value)
-o/--output: output plot file path (required)
--fig-width: figure width in inches (auto-scaled if omitted)
--fig-height: figure height in inches (auto-scaled if omitted)
--dpi: resolution in DPI (default: 300)
--no-title: hide the plot title
--title: custom title text
--legend-position: legend location (e.g., "upper right", "none" to hide)
--ylabel-fontsize: font size for y-axis labels; 0 to hide
--xlabel-fontsize: font size for x-axis labels; 0 to hide
--title-fontsize: font size for the title
--axis-fontsize: font size for axis labels
--colors: comma-separated colors (hex or named)
--ladderize: ladderize (sort) the tree before plotting
--cladogram: draw cladogram (equal branch lengths, tips aligned) instead of phylogram
--circular: draw circular (radial/fan) phylogram instead of rectangular
--color-file: color annotation file for tip labels, clade ranges, and branch colors (iTOL-inspired TSV format)
--json: optional argument to print results as JSON