Concordance-aware ancestral state reconstruction
ASR incorporating gene tree discordance
Command identity
- Canonical command:
concordance_asr- Handler:
concordance_asr- Aliases:
casr, conc_asr
- Standalone executables:
pk_concordance_asr, pk_casr, pk_conc_asr
- Categories:
Trait evolution
Runtime interface
Synopsis
phykit concordance_asr --tree <tree> --gene-trees <gene_trees> --trait_data <trait_data> [--trait <trait>] [--method <method>] [--ci] [--plot <plot>] [--plot-uncertainty <plot_uncertainty>] [--missing-taxa <missing_taxa>] [--fig-width <fig_width>] [--fig-height <fig_height>] [--dpi <dpi>] [--no-title] [--title <title>] [--legend-position <legend_position>] [--ylabel-fontsize <ylabel_fontsize>] [--xlabel-fontsize <xlabel_fontsize>] [--title-fontsize <title_fontsize>] [--axis-fontsize <axis_fontsize>] [--colors <colors>] [--ladderize] [--cladogram] [--circular] [--color-file <color_file>] [--json]
Arguments
This table is generated from the live command parser. It is the authoritative source for accepted spellings, required arguments, types, defaults, and choices.
Argument |
Required |
Type |
Default |
Choices |
|---|---|---|---|---|
|
true |
str |
required |
any |
|
true |
str |
required |
any |
|
true |
str |
required |
any |
|
false |
str |
none |
any |
|
false |
str |
weighted |
weighted, distribution |
|
false |
boolean |
false |
any |
|
false |
str |
none |
any |
|
false |
str |
none |
any |
|
false |
str |
shared |
error, shared |
|
false |
float |
none |
any |
|
false |
float |
none |
any |
|
false |
int |
300 |
any |
|
false |
boolean |
false |
any |
|
false |
str |
none |
any |
|
false |
str |
none |
any |
|
false |
float |
none |
any |
|
false |
float |
none |
any |
|
false |
float |
none |
any |
|
false |
float |
none |
any |
|
false |
str |
none |
any |
|
false |
boolean |
false |
any |
|
false |
boolean |
false |
any |
|
false |
boolean |
false |
any |
|
false |
str |
none |
any |
|
false |
boolean |
false |
any |
Output and errors
--json provides the command's structured JSON representation. Unless the guidance below states otherwise, results are emitted as command output. Invalid command syntax exits with status 2. Input
validation and scientific limitations are described in the guidance below.
Guidance, interpretation, and examples
Concordance-aware ancestral state reconstruction that incorporates gene tree discordance into ancestral estimates. Standard ASR operates on a single species tree and ignores gene tree conflict. This command propagates topological uncertainty from gene tree discordance into ancestral state estimates using gene concordance factors (gCF).
Two strategies are available:
weighted (default): For each internal node, compute gCF (fraction of gene trees supporting the species-tree bipartition) and gDF1, gDF2 (fractions for NNI alternatives). Run ASR on the species tree and NNI alternative trees, then combine estimates weighted by concordance. Uses the law of total variance to separate topological vs parameter uncertainty.
distribution: Run ASR independently on each gene tree, map nodes across trees by descendant-set identity, and report concordance-weighted means with percentile confidence intervals (2.5th--97.5th).
phykit concordance_asr -t <species_tree> -g <gene_trees> -d <trait_data>
    [-c <trait>] [-m weighted|distribution] [--ci]
    [--plot <output>] [--plot-uncertainty <output>] [--missing-taxa error|shared]
    [--fig-width <float>] [--fig-height <float>] [--dpi <int>] [--no-title] [--title <str>]
    [--legend-position <str>] [--ylabel-fontsize <float>] [--xlabel-fontsize <float>]
    [--title-fontsize <float>] [--axis-fontsize <float>] [--colors <str>] [--ladderize] [--cladogram] [--circular] [--color-file <file>] [--json]
Options:
-t/--tree: species tree file
-g/--gene-trees: file with gene trees (multi-Newick, one per line)
-d/--trait_data: trait data file (two-column or multi-trait with header)
-c/--trait: trait column name (required for multi-trait files)
-m/--method: method to use: weighted or distribution (default: weighted)
--ci: include 95% confidence intervals
--plot: output path for concordance ASR contMap plot
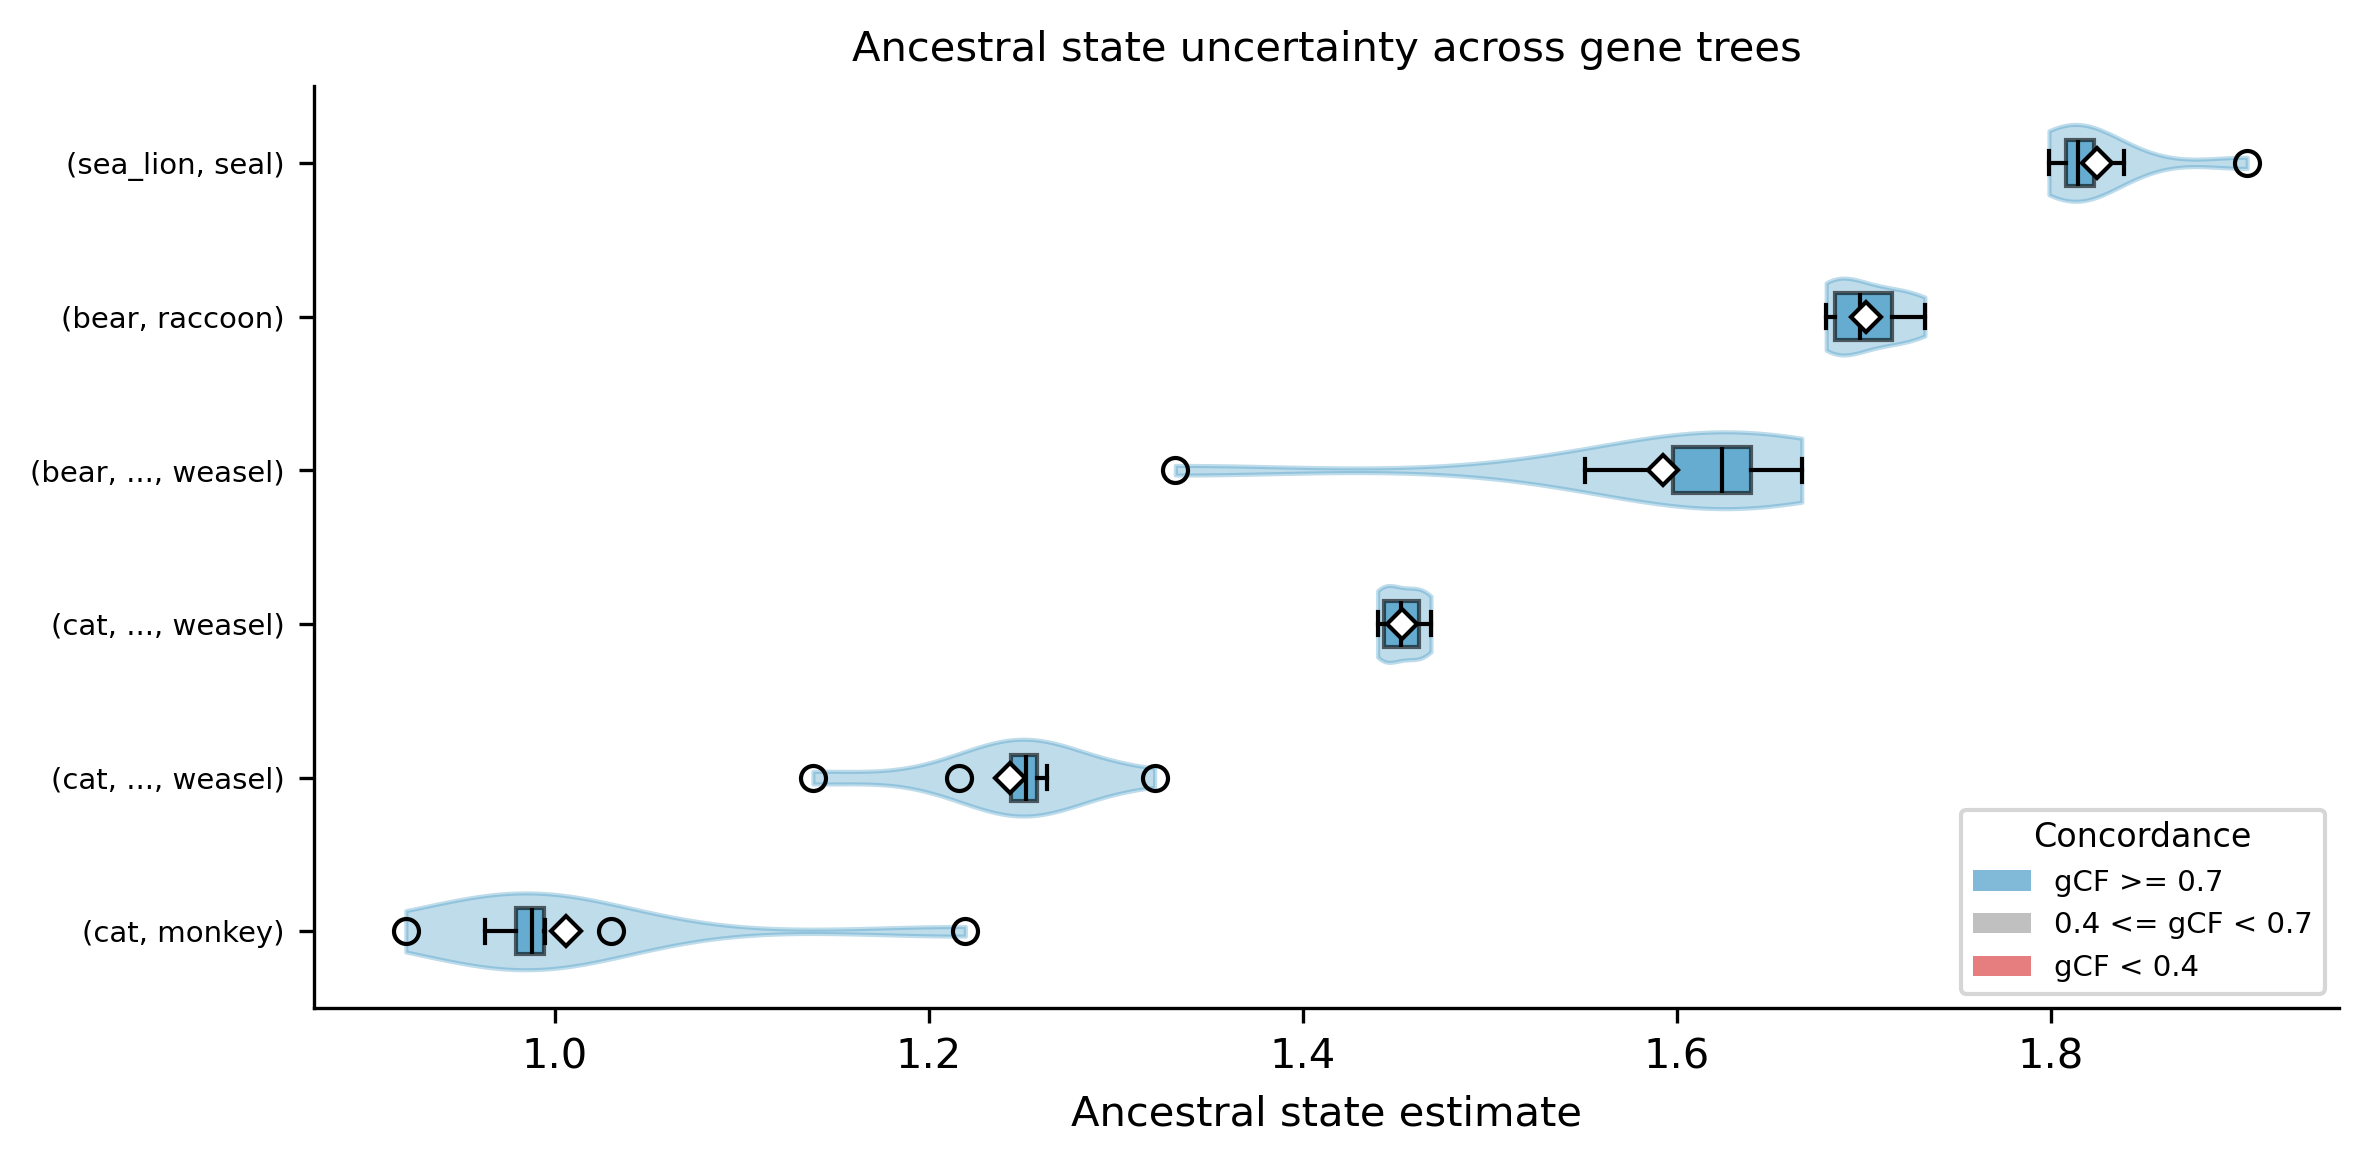
--plot-uncertainty: output path for uncertainty plot showing the distribution of ancestral estimates across gene trees (distribution method) or concordance sources (weighted method) as violin + boxplots colored by gCF
--missing-taxa: how to handle taxa mismatches: shared (default, prune to intersection) or error (reject)
--fig-width: figure width in inches (auto-scaled if omitted)
--fig-height: figure height in inches (auto-scaled if omitted)
--dpi: resolution in DPI (default: 300)
--no-title: hide the plot title
--title: custom title text
--legend-position: legend location (e.g., "upper right", "none" to hide)
--ylabel-fontsize: font size for y-axis labels; 0 to hide
--xlabel-fontsize: font size for x-axis labels; 0 to hide
--title-fontsize: font size for the title
--axis-fontsize: font size for axis labels
--colors: comma-separated colors (hex or named)
--ladderize: ladderize (sort) the tree before plotting
--cladogram: draw cladogram (equal branch lengths, tips aligned) instead of phylogram
--circular: draw circular (radial/fan) phylogram instead of rectangular
--color-file: color annotation file for tip labels, clade ranges, and branch colors (iTOL-inspired TSV format)
--json: output results as JSON
Example output:
Concordance-Aware Ancestral State Reconstruction

Method: weighted
Number of tips: 8
Number of gene trees: 10
Sigma-squared (BM rate): 0.043893

Ancestral estimates:
  Node          Desc    Estimate     gCF                  95% CI    Var_topo   Var_param
  N1 (root)        8      1.6447   1.000        [0.8937, 2.3957]    0.000000    0.146822
  N2               2      1.6881   0.700        [0.9529, 2.4234]    0.000569    0.140151
  N3               5      1.4878   0.857        [0.6727, 2.3028]    0.005878    0.167045
  N4               2      1.7682   0.900        [0.8987, 2.6378]    0.015002    0.181806
  N5               3      1.2674   0.900        [0.3663, 2.1684]    0.001044    0.210295
  N6               2      0.9895   1.000       [-0.5654, 2.5443]    0.000000    0.629294
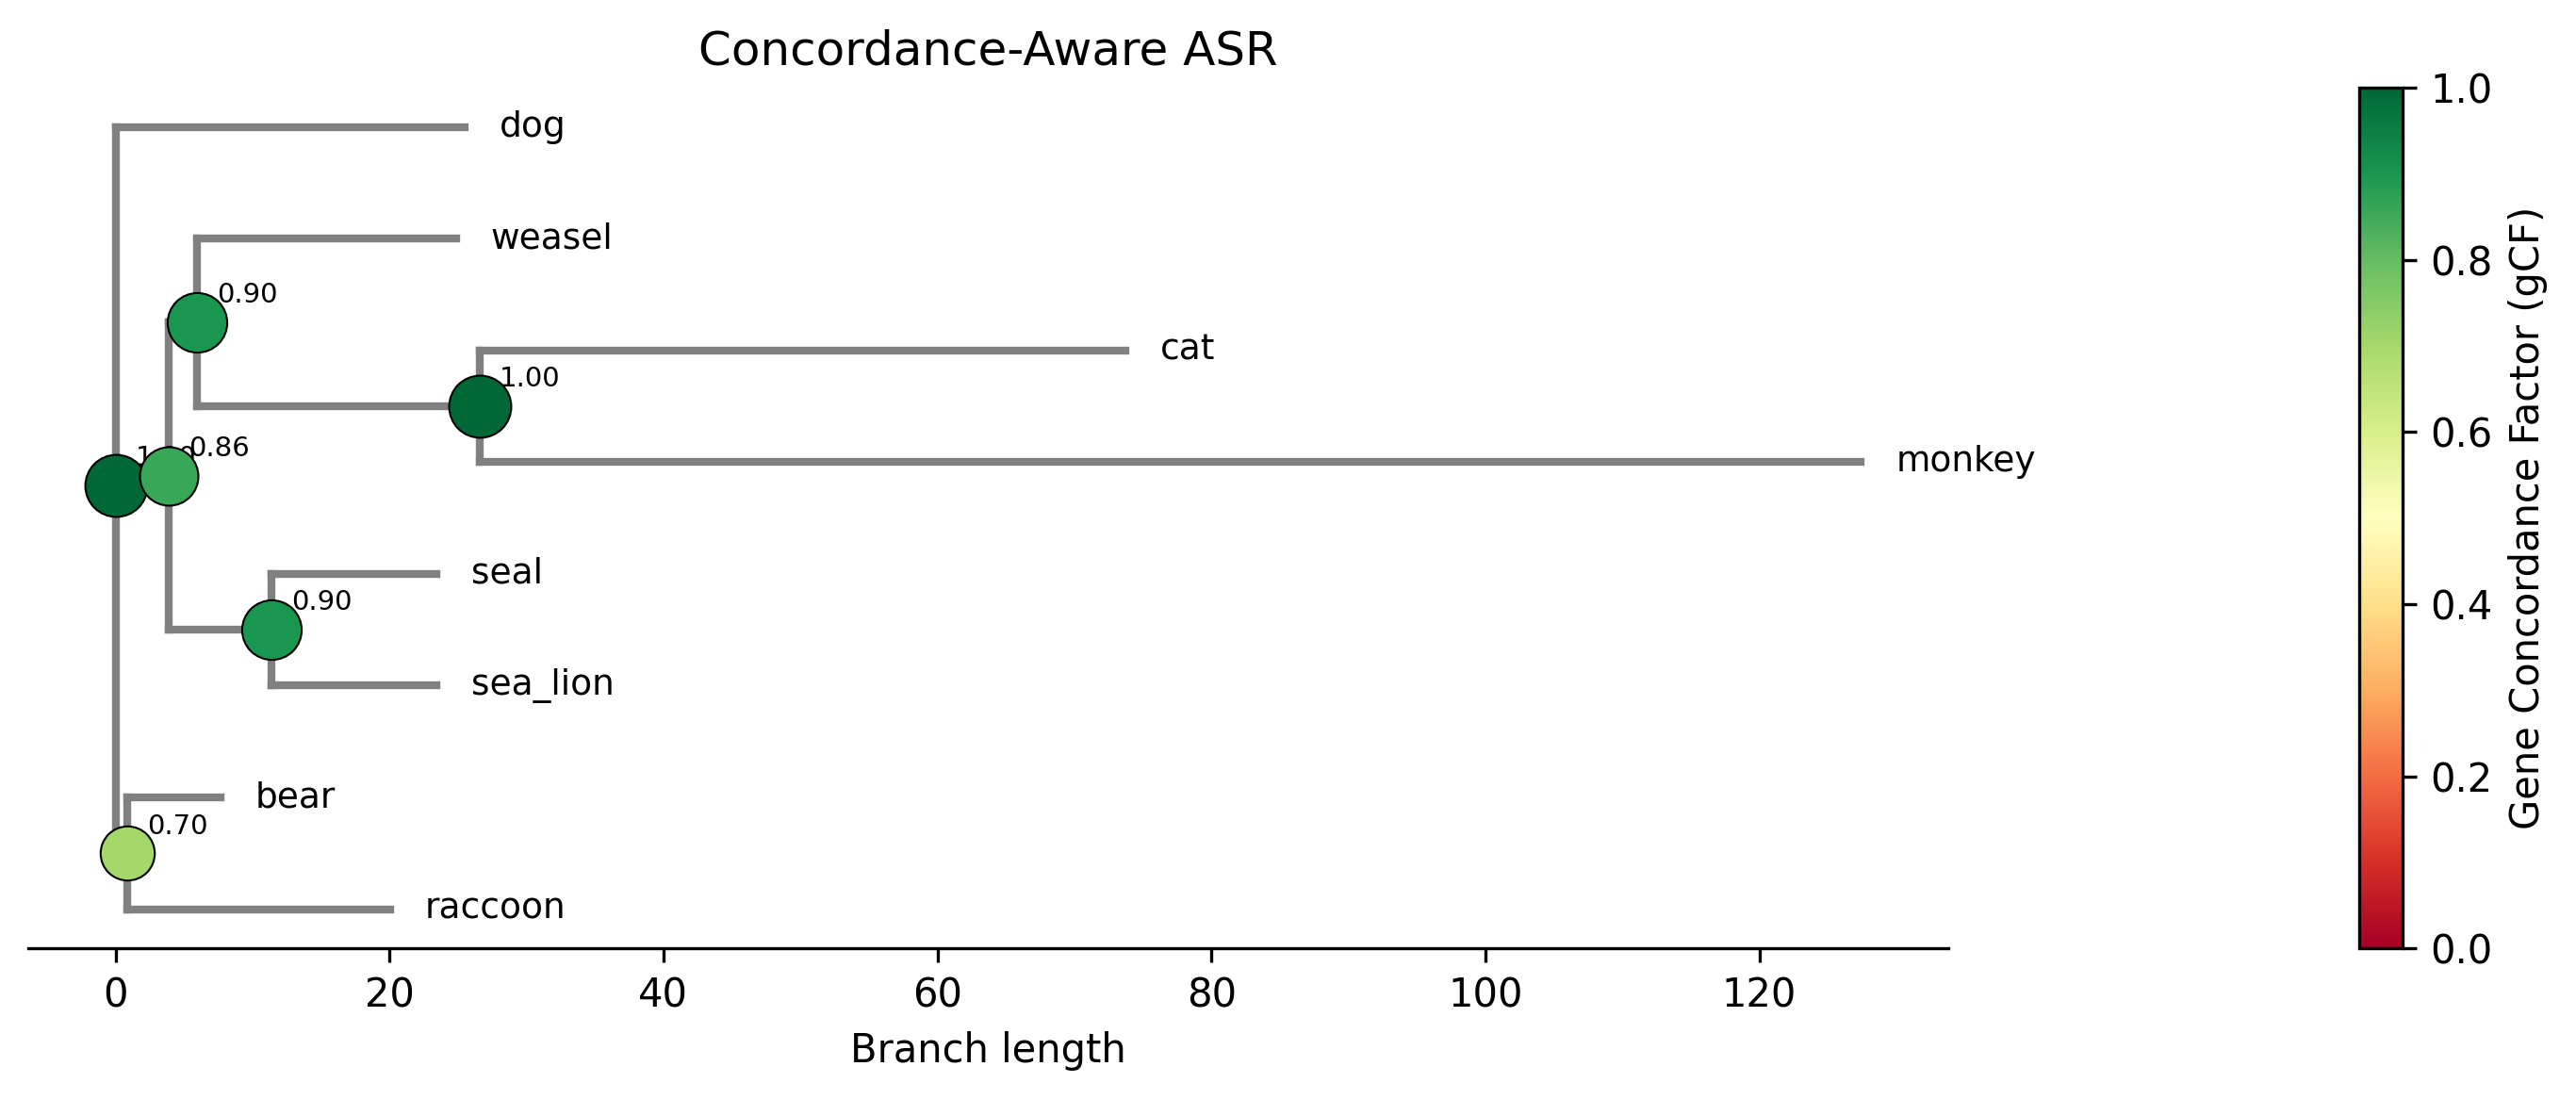
Example plot generated with the --plot option. Internal nodes are sized
and colored by gene concordance factor (gCF):
The --plot-uncertainty option generates a violin + boxplot showing the
distribution of ancestral state estimates for each internal node. For the
distribution method, each violin shows per-gene-tree estimates. For the
weighted method, each violin shows the concordant and discordant source
estimates. Nodes are colored by gCF: blue (gCF >= 0.7, high concordance),
gray (0.4 <= gCF < 0.7), red (gCF < 0.4, high discordance). Wide violins
indicate high uncertainty — the ancestral estimate varies substantially
across gene trees, suggesting that gene tree conflict propagates into
trait estimates at that node.