Phylogenetic heatmap
Phylogeny alongside a heatmap of numeric trait values
Command identity
- Canonical command:
phylo_heatmap- Handler:
phylo_heatmap- Aliases:
ph, pheatmap
- Standalone executables:
pk_phylo_heatmap, pk_ph, pk_pheatmap
- Categories:
Trait evolution
Runtime interface
Synopsis
phykit phylo_heatmap --tree <tree> --data <data> --output <output> [--split <split>] [--standardize] [--cmap <cmap>] [--cluster-columns] [--fig-width <fig_width>] [--fig-height <fig_height>] [--dpi <dpi>] [--no-title] [--title <title>] [--legend-position <legend_position>] [--ylabel-fontsize <ylabel_fontsize>] [--xlabel-fontsize <xlabel_fontsize>] [--title-fontsize <title_fontsize>] [--axis-fontsize <axis_fontsize>] [--colors <colors>] [--ladderize] [--cladogram] [--circular] [--color-file <color_file>] [--json]
Arguments
This table is generated from the live command parser. It is the authoritative source for accepted spellings, required arguments, types, defaults, and choices.
Argument |
Required |
Type |
Default |
Choices |
|---|---|---|---|---|
|
true |
str |
required |
any |
|
true |
str |
required |
any |
|
true |
str |
required |
any |
|
false |
float |
0.3 |
any |
|
false |
boolean |
false |
any |
|
false |
str |
viridis |
any |
|
false |
boolean |
false |
any |
|
false |
float |
none |
any |
|
false |
float |
none |
any |
|
false |
int |
300 |
any |
|
false |
boolean |
false |
any |
|
false |
str |
none |
any |
|
false |
str |
none |
any |
|
false |
float |
none |
any |
|
false |
float |
none |
any |
|
false |
float |
none |
any |
|
false |
float |
none |
any |
|
false |
str |
none |
any |
|
false |
boolean |
false |
any |
|
false |
boolean |
false |
any |
|
false |
boolean |
false |
any |
|
false |
str |
none |
any |
|
false |
boolean |
false |
any |
Output and errors
--json provides the command's structured JSON representation. Output-file options: --output. Invalid command syntax exits with status 2. Input
validation and scientific limitations are described in the guidance below.
Guidance, interpretation, and examples
Draw a phylogenetic heatmap: a phylogeny alongside a color-coded matrix of numeric trait values, with rows aligned to tree tips. Analogous to R's phytools::phylo.heatmap().
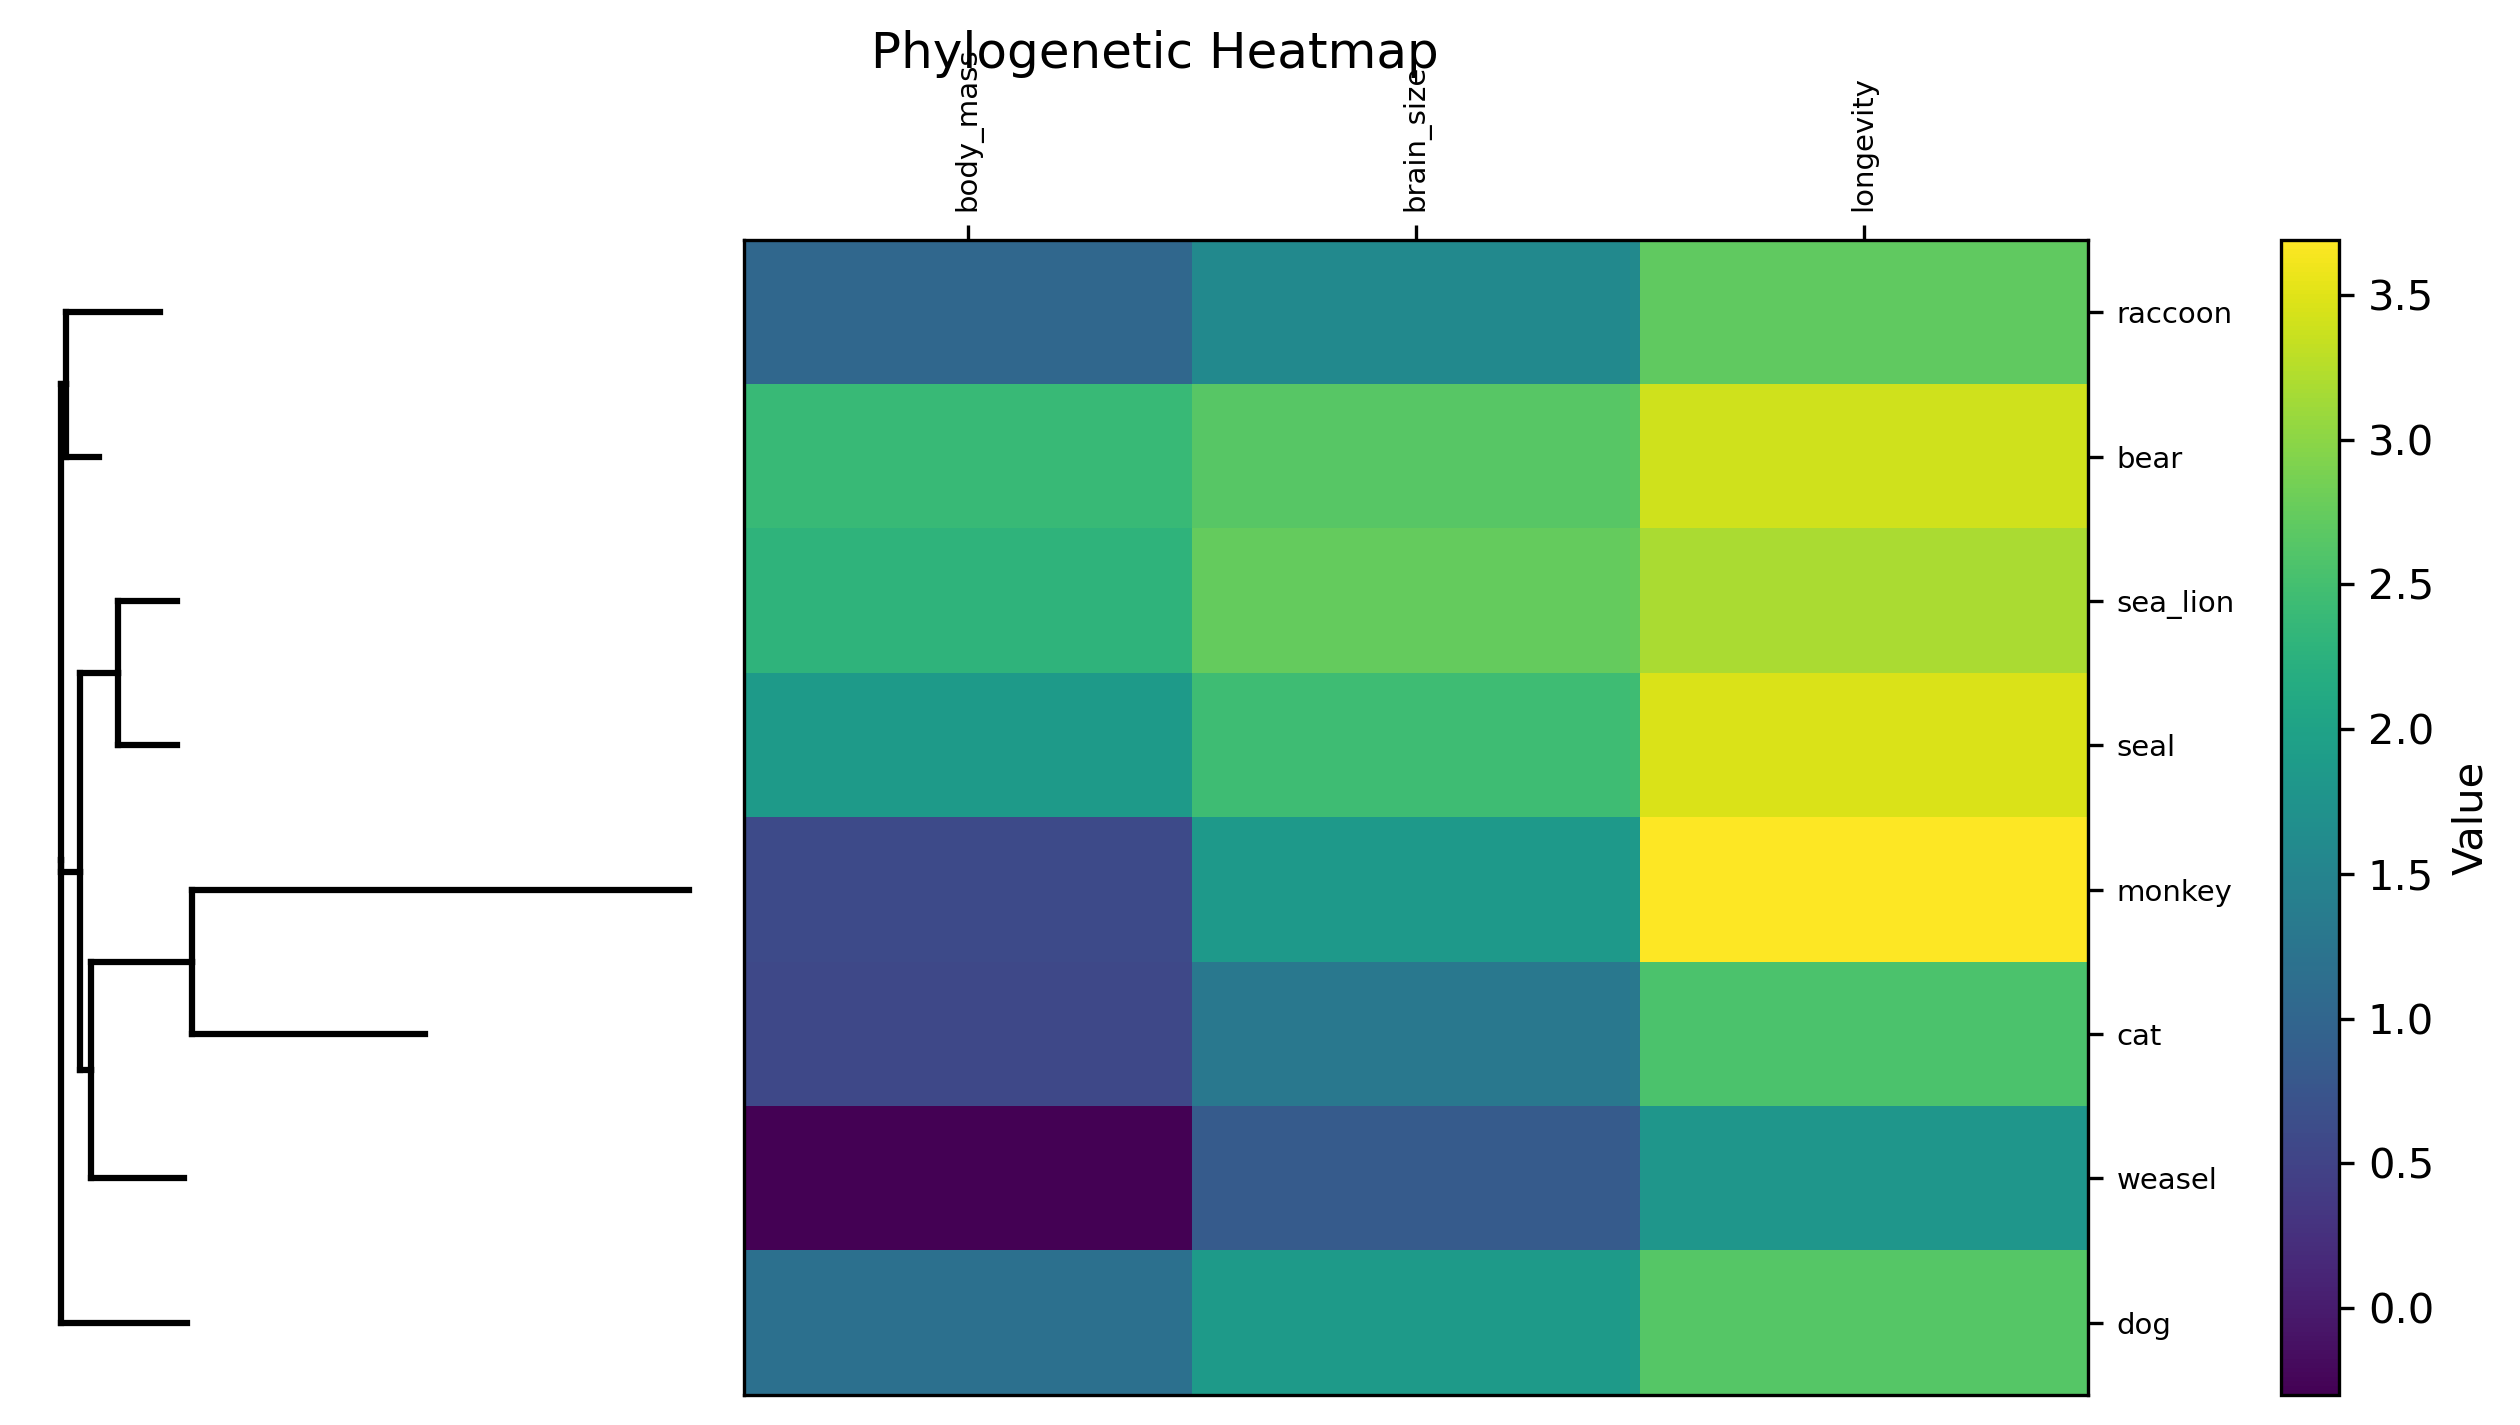
phykit phylo_heatmap -t <tree> -d <data> -o <output>
        [--split 0.3] [--standardize] [--cmap viridis] [--cluster-columns] [--json]
Options:
-t/--tree: tree file (required)
-d/--data: numeric data matrix in TSV format with header row (required)
-o/--output: output figure path (required; supports .png, .pdf, .svg)
--split: fraction of figure width for the tree panel (default: 0.3)
--standardize: z-score each column before coloring
--cmap: matplotlib colormap name (default: viridis)
--cluster-columns: cluster trait columns by similarity and display a dendrogram at the top
--json: optional argument to output metadata as JSON