Tutorial 8: Visualizing trait evolution with phylomorphospace
Objectives
Complete the visualizing trait evolution with phylomorphospace workflow.
Interpret the reported values and generated artifacts in their scientific context.
Identify the canonical command references for each analysis step.
Prerequisites and working directory
Install the current PhyKIT release and create a dedicated working directory. Download the data linked in this tutorial into that directory before running the commands. All paths below are relative to this directory.
mkdir phykit-tutorial-08
cd phykit-tutorial-08
Workflow
Phylomorphospace plots overlay the phylogeny onto a two-dimensional trait space, connecting species to their ancestors via edges that trace the evolutionary trajectory of traits (Sidlauskas 2008). Internal node positions are estimated by maximum-likelihood ancestral state reconstruction. This visualization reveals how lineages have moved through morphospace over evolutionary time — showing convergence, divergence, and the overall geometry of trait evolution.
Hypothetical study question. Suppose we want to visualize how body mass and brain size have coevolved across our eight mammal species. Do closely related species cluster together in trait space? Have any lineages converged on similar body mass–brain size combinations despite being distantly related?
PhyKIT's phylomorphospace command (aliases: phylomorpho, phmo) generates these
plots directly from the command line.
Download test data:
Mammal phylogeny;
Multi-trait data
Step 0: Prepare data
Two input files are needed: a phylogenetic tree and a tab-delimited multi-trait file with a
header row (same format as for phylogenetic PCA). When the trait file has exactly two trait
columns, they are automatically selected. With three or more traits, you must specify
which two traits to plot using --trait-x and --trait-y.
Step 1: Generate a phylomorphospace plot
Since our trait file has three traits (body_mass, brain_size, longevity), we specify which two to plot:
phykit phylomorphospace \
    -t tree_simple.tre \
    -d tree_simple_multi_traits.tsv \
    --trait-x body_mass \
    --trait-y brain_size
This generates a plot file (phylomorphospace_plot.png by default) showing:
Tip points positioned at observed trait values for each species
Internal nodes positioned at ML-reconstructed ancestral trait values
Tree edges connecting parent and child nodes, colored by distance from the root (coolwarm colormap with colorbar)
Tip labels identifying each species
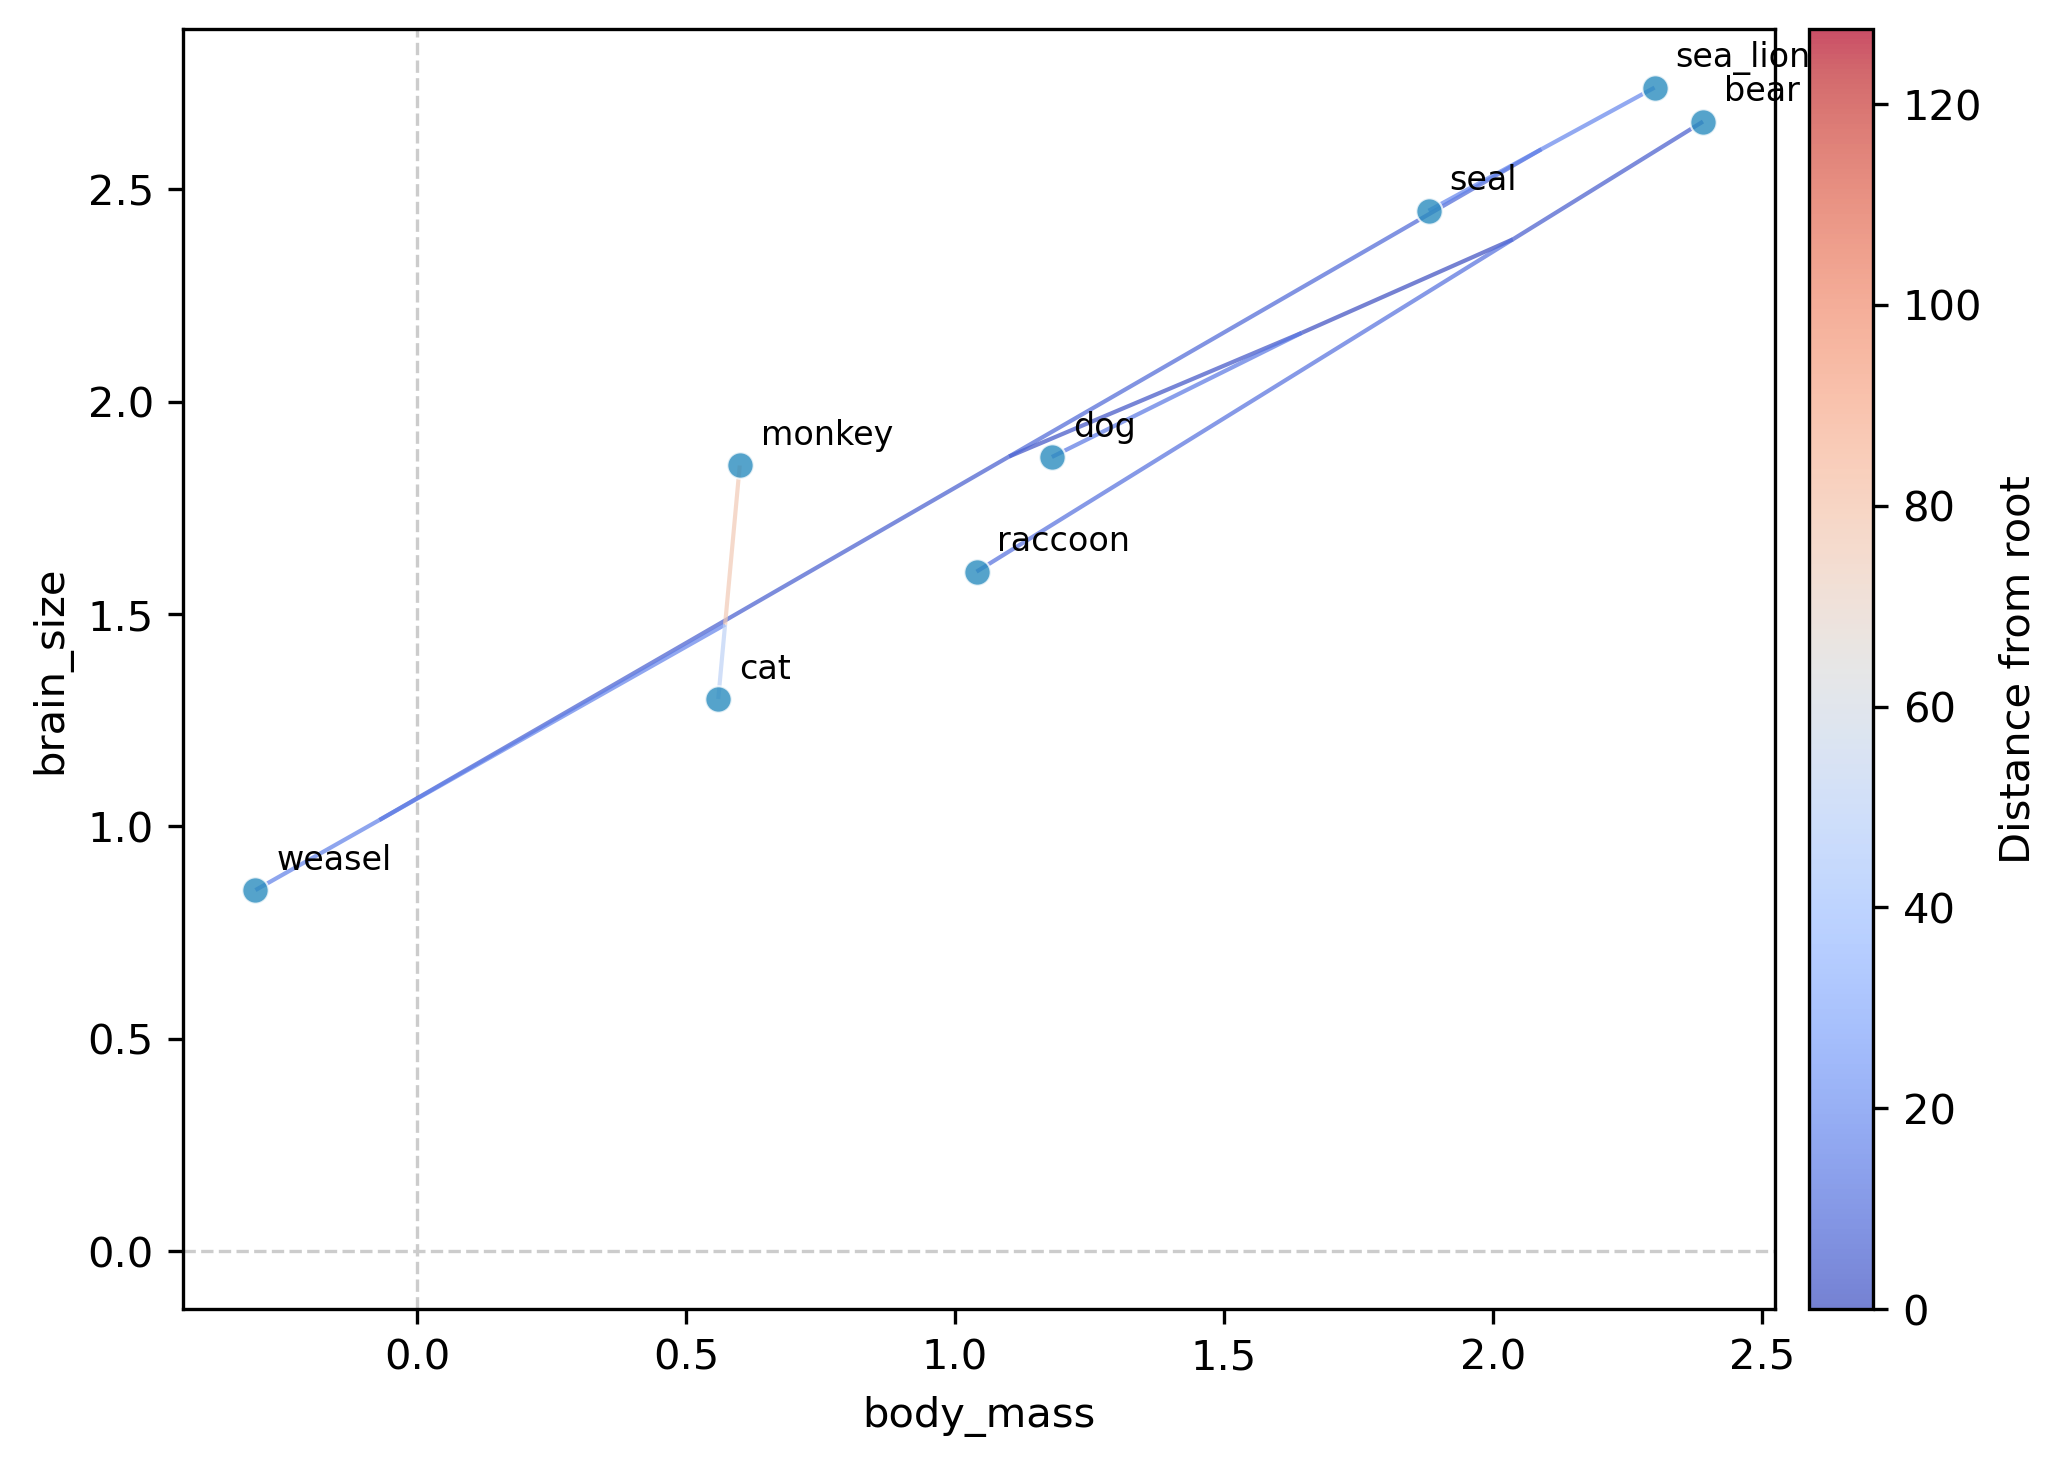
Interpretation. In the resulting plot, species with large body mass and brain size (bear, sea_lion, seal) cluster in the upper right, while small-bodied species (weasel, cat) appear in the lower left. The tree edges show the evolutionary trajectories: the ancestral node reconstructions reveal whether lineages traveled through morphospace gradually or underwent rapid shifts.
Step 2: Export data as JSON
For programmatic access to the tip data and reconstructed ancestral states:
phykit phylomorphospace \
    -t tree_simple.tre \
    -d tree_simple_multi_traits.tsv \
    --trait-x body_mass \
    --trait-y brain_size \
    --json
The JSON output includes the tip data, selected traits, and output path, enabling custom post-processing or alternative visualizations.
Summary
In this tutorial, we used phylomorphospace to visualize the coevolution of body mass and brain size across a mammal phylogeny. The plot reveals evolutionary trajectories through trait space and highlights patterns of convergence or divergence. Combined with phylogenetic PCA and phylogenetic signal analyses, phylomorphospace provides a powerful complement for understanding multivariate trait evolution.
For methodological details, see
Sidlauskas (2008).
The R equivalent is phytools::phylomorphospace()
(Revell 2012).
Expected artifacts
Each step identifies its expected terminal output or generated files. Confirm that those artifacts exist before continuing to the next step; filenames are relative to the tutorial working directory unless an absolute path is shown.
Troubleshooting
Run
phykit <command> --helpto compare an invocation with the live interface.Confirm that downloaded files are in the current working directory and retain the filenames shown in the tutorial.
For parsing errors, compare taxon names exactly across alignments, trees, and trait tables, including capitalization and underscores.
See Troubleshooting for installation, format, and error-reporting guidance.