Tutorial 20: Gene tree discordance analysis pipeline
Objectives
Complete the gene tree discordance analysis pipeline workflow.
Interpret the reported values and generated artifacts in their scientific context.
Identify the canonical command references for each analysis step.
Prerequisites and working directory
Install the current PhyKIT release and create a dedicated working directory. Download the data linked in this tutorial into that directory before running the commands. All paths below are relative to this directory.
mkdir phykit-tutorial-20
cd phykit-tutorial-20
Workflow
Gene trees often disagree with the species tree due to incomplete lineage sorting (ILS), introgression, or gene duplication and loss. This tutorial demonstrates how to quantify and visualize gene tree discordance, reconstruct ancestral states that account for it, and incorporate it into comparative methods — all using PhyKIT.
Scenario
Imagine you have sequenced 200 genes across a clade that underwent a rapid radiation — for example, a group of closely related yeast species or a recent adaptive radiation of cichlid fishes. You have already inferred a species tree (e.g., via ASTRAL or concatenation) and individual gene trees for each locus. You suspect that the rapid radiation produced substantial incomplete lineage sorting, and perhaps introgression between some lineages. Before running any downstream comparative analysis, you want to know: how much gene tree conflict exists, and does it matter for my trait analyses?
Specifically, you want to (1) visualize which bipartitions in the species tree are well-supported vs. contested across gene trees, (2) reconstruct the ancestral value of a continuous trait (e.g., thermal tolerance) while accounting for the topological uncertainty from discordance, and (3) test whether a trait-trait relationship (e.g., thermal tolerance vs. metabolic rate) holds up when the variance-covariance matrix reflects the full landscape of gene tree histories rather than just the species tree.
Overview
We will:
Quantify gene tree conflict with a splits network (
consensus_network)Test for rate-topology associations (
evo_tempo_map)Test for asymmetric discordance / gene flow (
discordance_asymmetry)Identify diversification patterns (
ltt)Reconstruct ancestral states accounting for discordance (
concordance_asr)Run comparative methods with discordance-aware variance-covariance matrices (
pgls,phylogenetic_signal,fit_continuous)
Data files used in this tutorial:
Download test data:
Mammal phylogeny (species tree);
Gene trees (10 loci);
Continuous trait data;
Multi-trait data
tree_simple.tre— an eight-taxon mammal species tree in Newick formatgene_trees_simple.nwk— 10 gene trees (one per line), most concordant with the species tree but several with alternative topologiestree_simple_traits.tsv— body mass (log-transformed kg), tab-delimitedtree_simple_multi_traits.tsv— body mass, brain size, and longevity, tab-delimited with a header row
Step 1: Visualize gene tree conflict with a splits network
Start by understanding the landscape of gene tree disagreement. In our rapid-radiation scenario, we expect that some bipartitions in the species tree are supported by most gene trees while others are contested — the splits network will reveal exactly which relationships are robust and which are ambiguous.
phykit consensus_network -t gene_trees_simple.nwk
Expected output:
Number of input trees: 10
Number of taxa: 8
Threshold: 0.1
Total unique splits: 13
Splits above threshold: 13
---
{cat, monkey}           10/10   1.0000
{cat, monkey, weasel}    9/10   0.9000
{sea_lion, seal}         9/10   0.9000
{bear, raccoon}          7/10   0.7000
{bear, dog, raccoon}     6/10   0.6000
{bear, dog}              2/10   0.2000
...
The output shows that {cat, monkey} is supported by all 10 gene trees (fully concordant), while {bear, raccoon} is supported by only 7/10. The {bear, dog, raccoon} clade — which places dog with bear and raccoon rather than as an outgroup — is supported by only 6/10 gene trees. These lower-frequency splits indicate where gene tree conflict is concentrated.
Generate a visual network:
phykit consnet -t gene_trees_simple.nwk --plot-output splits_network.png
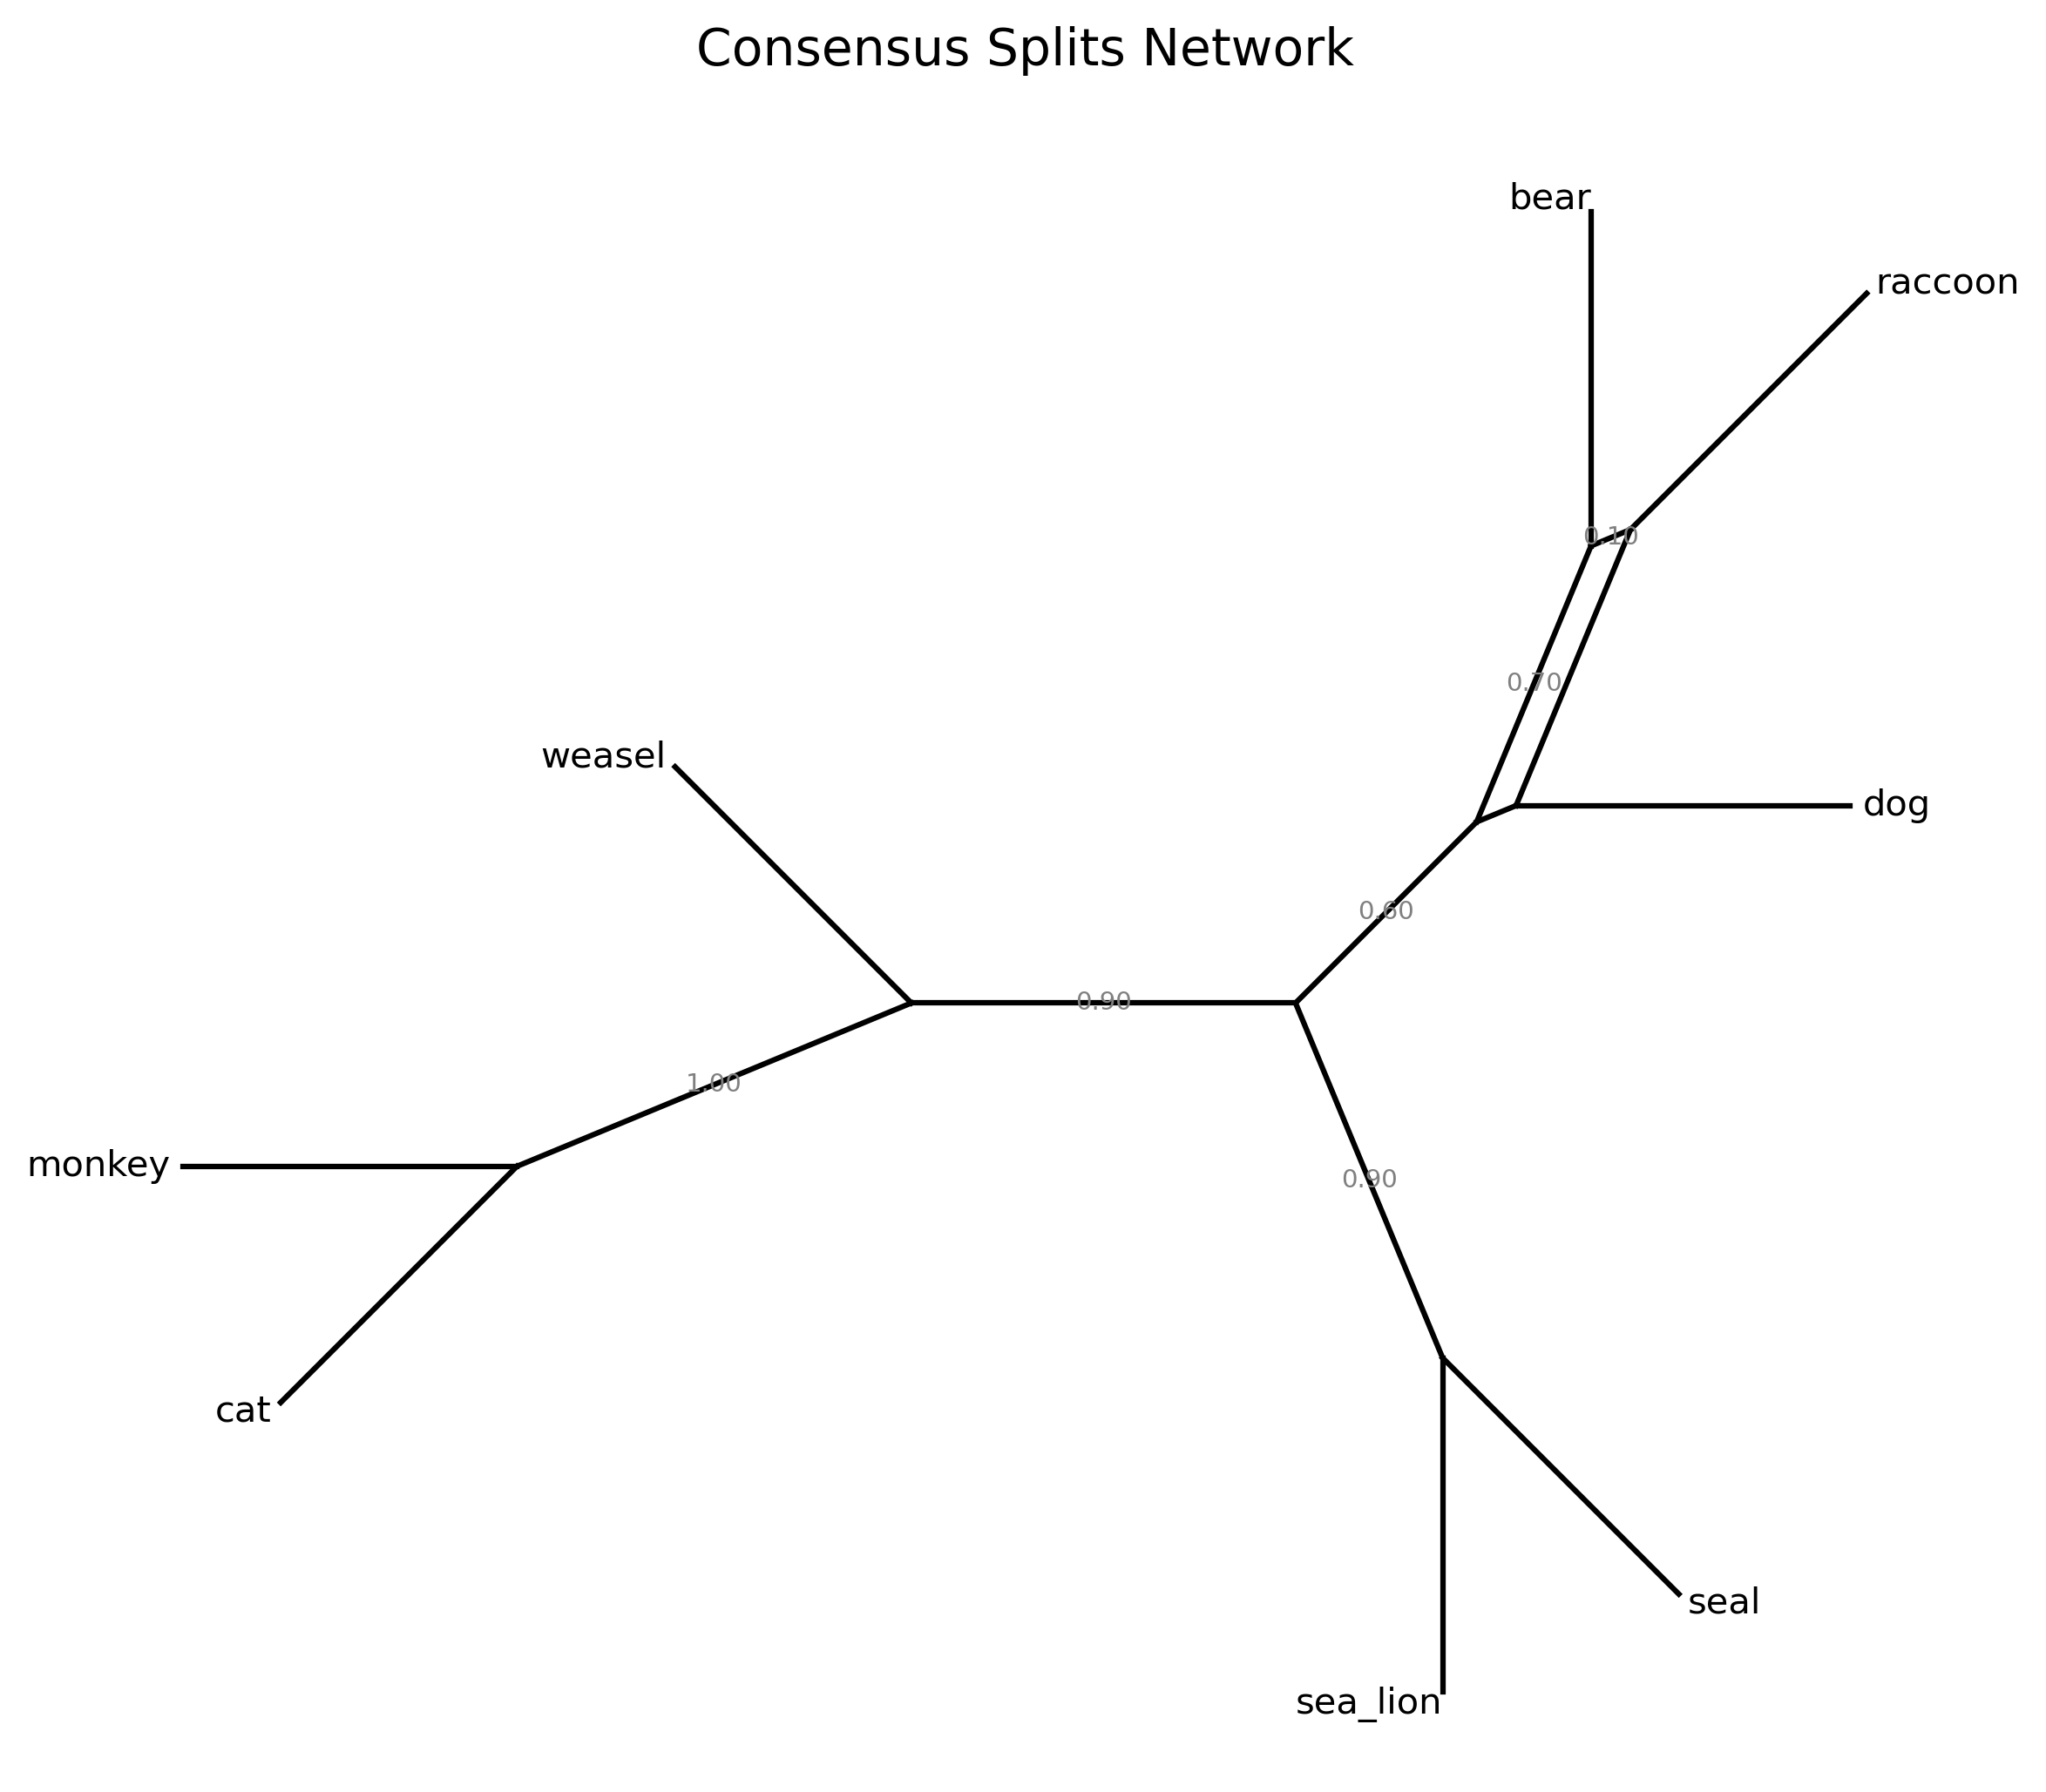
Thick chords represent well-supported splits; thin chords represent rare alternatives. A clean star-like network suggests minimal conflict; box-like structures indicate competing topologies. If the network shows substantial conflict, the downstream discordance-aware analyses in Steps 5-6 become especially important.
Step 2: Test for rate-topology associations with evolutionary tempo mapping
The splits network shows which branches have discordance — but do the discordant gene trees also differ in branch lengths? Under the coalescent, discordant gene trees should have shorter internal branches at the discordant node (deeper coalescence). If discordant gene trees instead show anomalously long branches, that suggests substitution rate heterogeneity correlated with topology — potentially adaptive evolution or systematic error from model misspecification.
phykit evo_tempo_map -t tree_simple.tre -g gene_trees_simple.nwk
Expected output:
branch                          n_conc  n_disc    med_conc    med_disc      U_pval   perm_pval       fdr_p
----------------------------------------------------------------------------------------------------------
bear,dog,raccoon                     6       1    3.875000    3.600000          NA          NA          NA
bear,raccoon                         7       3    0.880000    0.700000    0.516667    0.077000    0.516667
cat,monkey                          10       0   20.450000          NA          NA          NA          NA
cat,monkey,weasel                    9       1    2.120000    2.800000          NA          NA          NA
sea_lion,seal                        9       1    7.500000    7.200000          NA          NA          NA
---
Global treeness: concordant=0.126489 (n=6), discordant=0.119014 (n=4)
Branches tested: 1, significant (FDR<0.05): 0
The {bear,raccoon} branch is the only one with enough discordant gene trees (3) for a statistical test. The median branch length is 0.88 in concordant gene trees vs. 0.70 in discordant ones — shorter internal branches in the discordant trees, consistent with the coalescent expectation. The difference is not significant (U p = 0.52), suggesting neutral sorting rather than rate heterogeneity at this branch.
The global treeness comparison shows that concordant gene trees have slightly higher treeness (0.126 vs. 0.119), meaning they have proportionally more internal branch length. This is expected: concordant gene trees have resolved internodes, while discordant ones tend to have shorter internal branches from deeper coalescence.
To visualize the concordant vs. discordant branch length distributions:
phykit etm -t tree_simple.tre -g gene_trees_simple.nwk --plot tempo_map.png
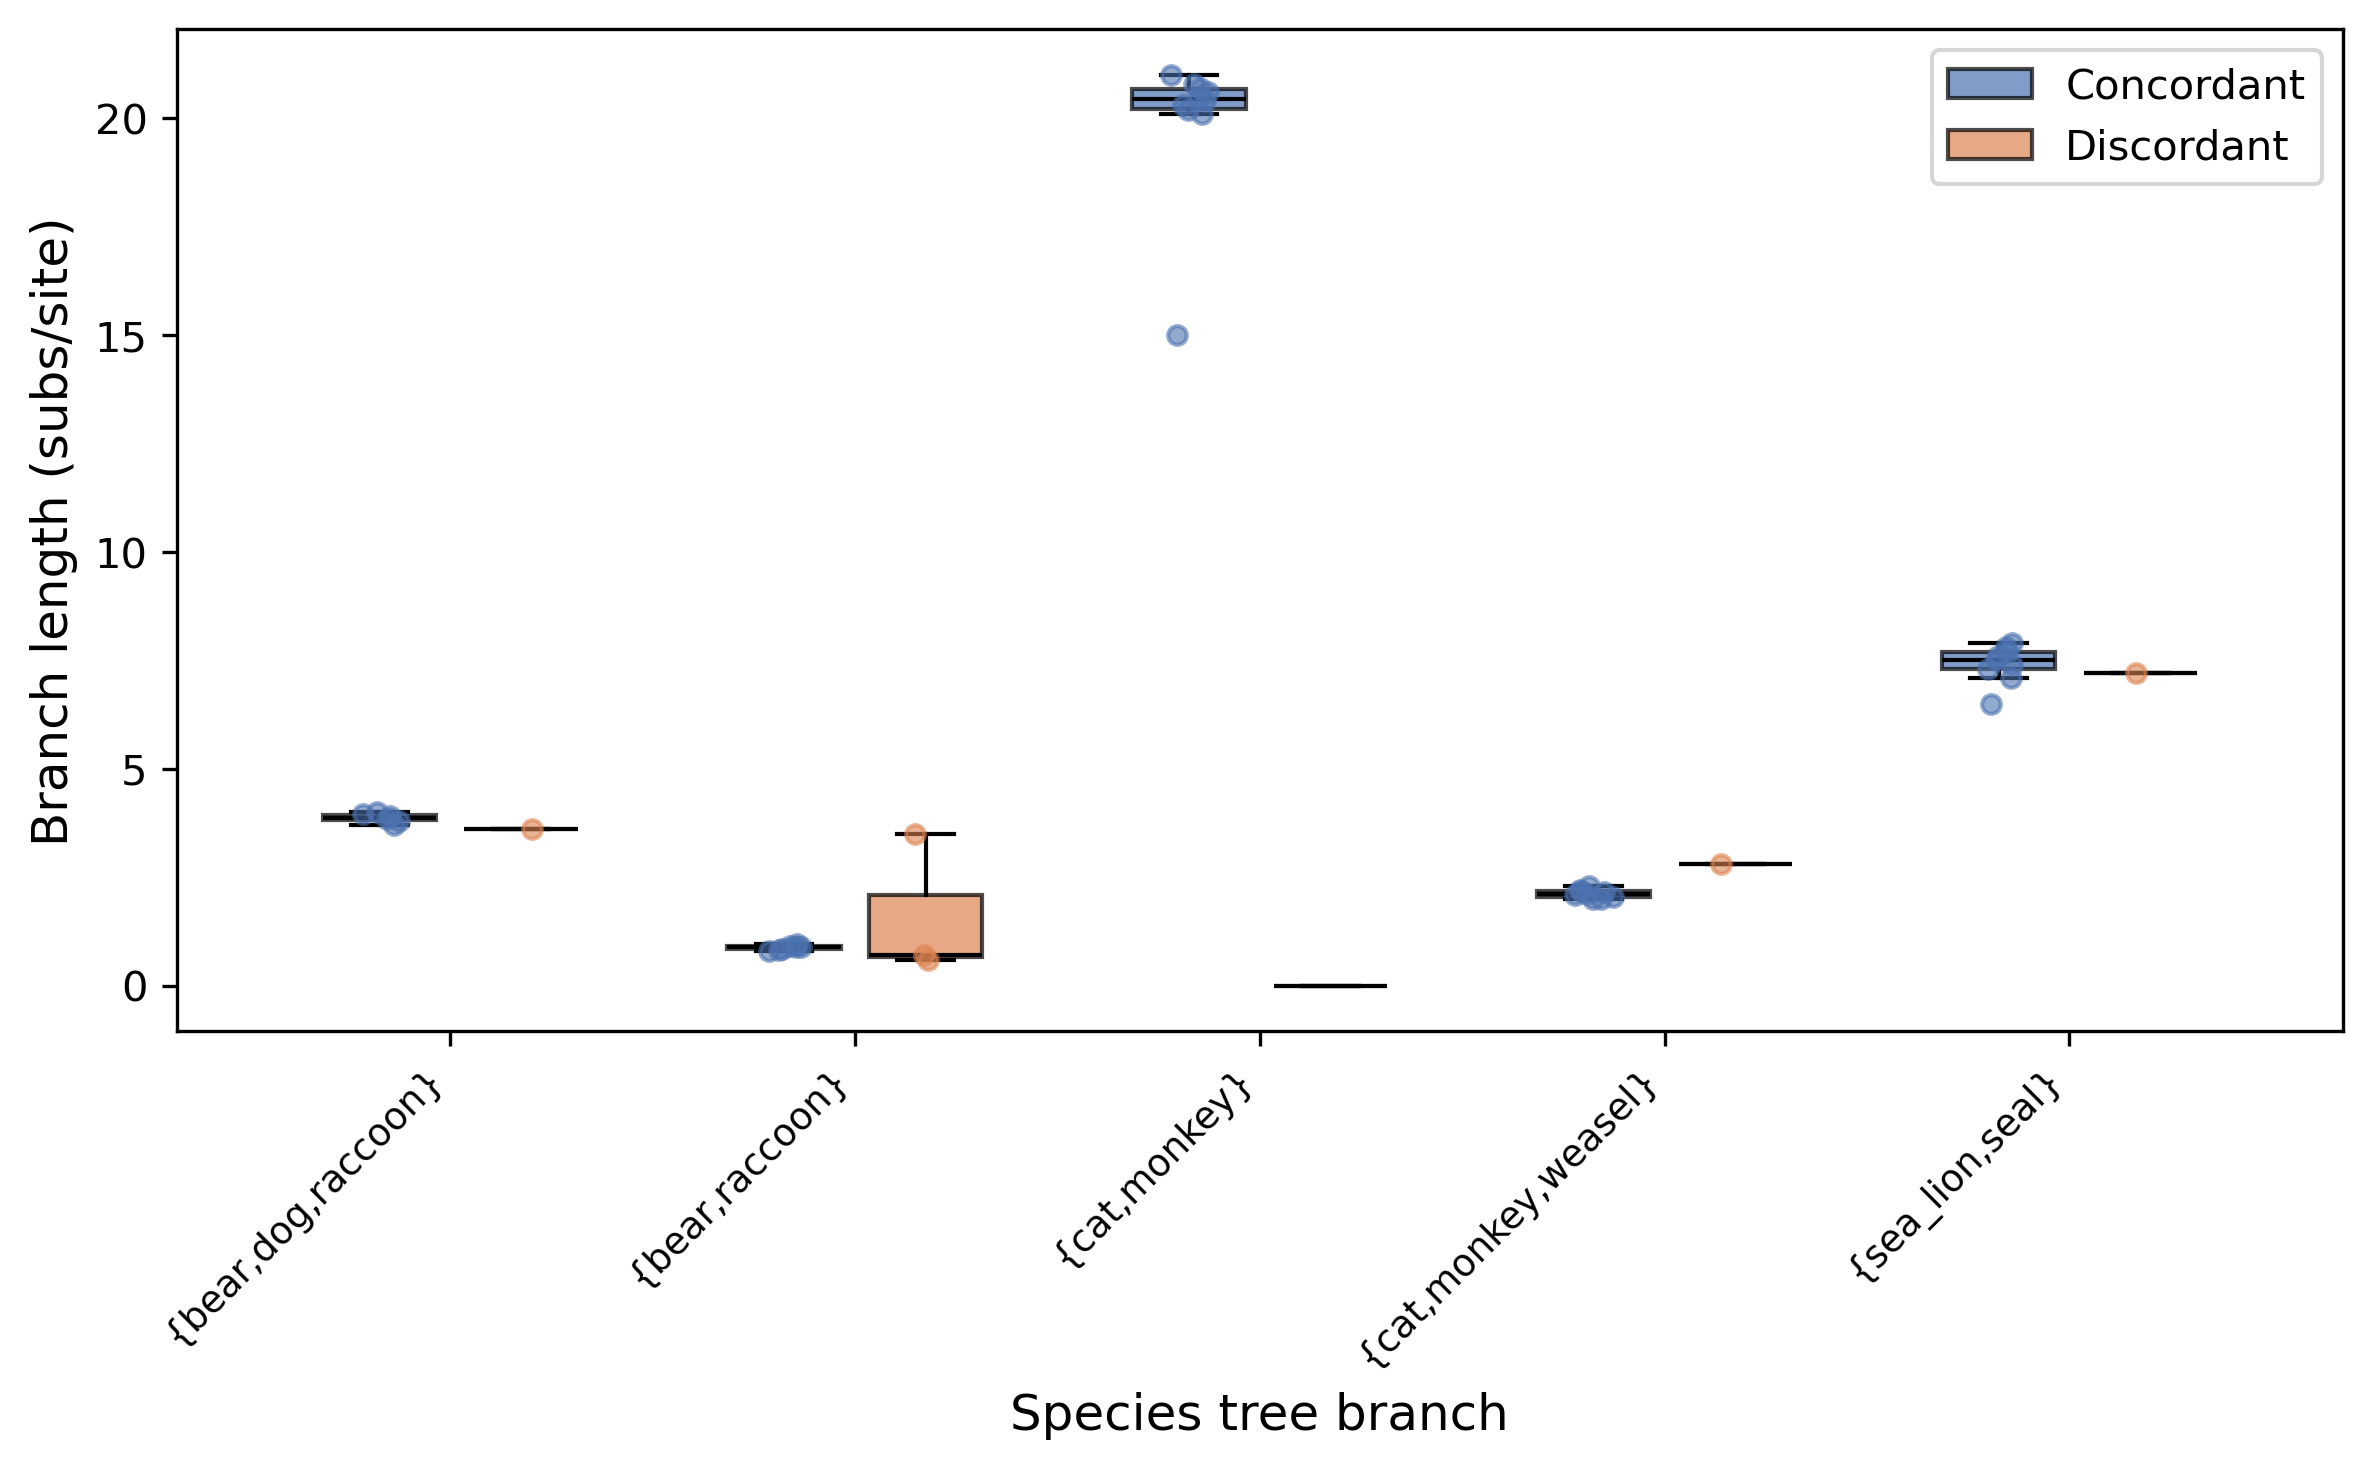
The box/strip plot shows concordant (blue) and discordant (orange) branch lengths at each species tree branch. Branches with significantly different distributions (FDR < 0.05) would be marked with an asterisk — none are significant in this small dataset.
Step 3: Test for asymmetric discordance (gene flow detection)
Step 2 told us whether discordant gene trees differ in branch lengths from concordant ones. Now we ask a complementary question: are the two possible discordant topologies at each branch equally frequent?
Under ILS alone, the two NNI alternative topologies (gDF1 and gDF2) should appear with equal probability. If one alternative is significantly more common, it suggests gene flow or introgression between specific lineages — because introgression biases gene tree topologies toward the alternative that groups the donor and recipient.
phykit discordance_asymmetry -t tree_simple.tre -g gene_trees_simple.nwk
Expected output:
branch                          n_conc  n_alt1  n_alt2  asym_ratio     binom_p       fdr_p   gene_flow
------------------------------------------------------------------------------------------------------
bear,dog,raccoon                     6       0       1       1.000      1.0000      1.0000           -
bear,raccoon                         7       1       2       0.667      1.0000      1.0000           -
cat,monkey                          10       0       0          NA          NA          NA           -
cat,monkey,weasel                    9       1       0       1.000      1.0000      1.0000           -
sea_lion,seal                        9       1       0       1.000      1.0000      1.0000           -
---
Summary: 4 branches tested, 0 significant (FDR<0.05)
No branches show significant asymmetry in this small dataset, which is consistent with the ILS-only scenario. The {bear,raccoon} branch has the most discordant gene trees (3 total: 1 alt1 + 2 alt2), but the difference between 1 and 2 is far from significant (binomial p = 1.0).
To visualize asymmetry on the phylogeny:
phykit da -t tree_simple.tre -g gene_trees_simple.nwk --plot asymmetry.png
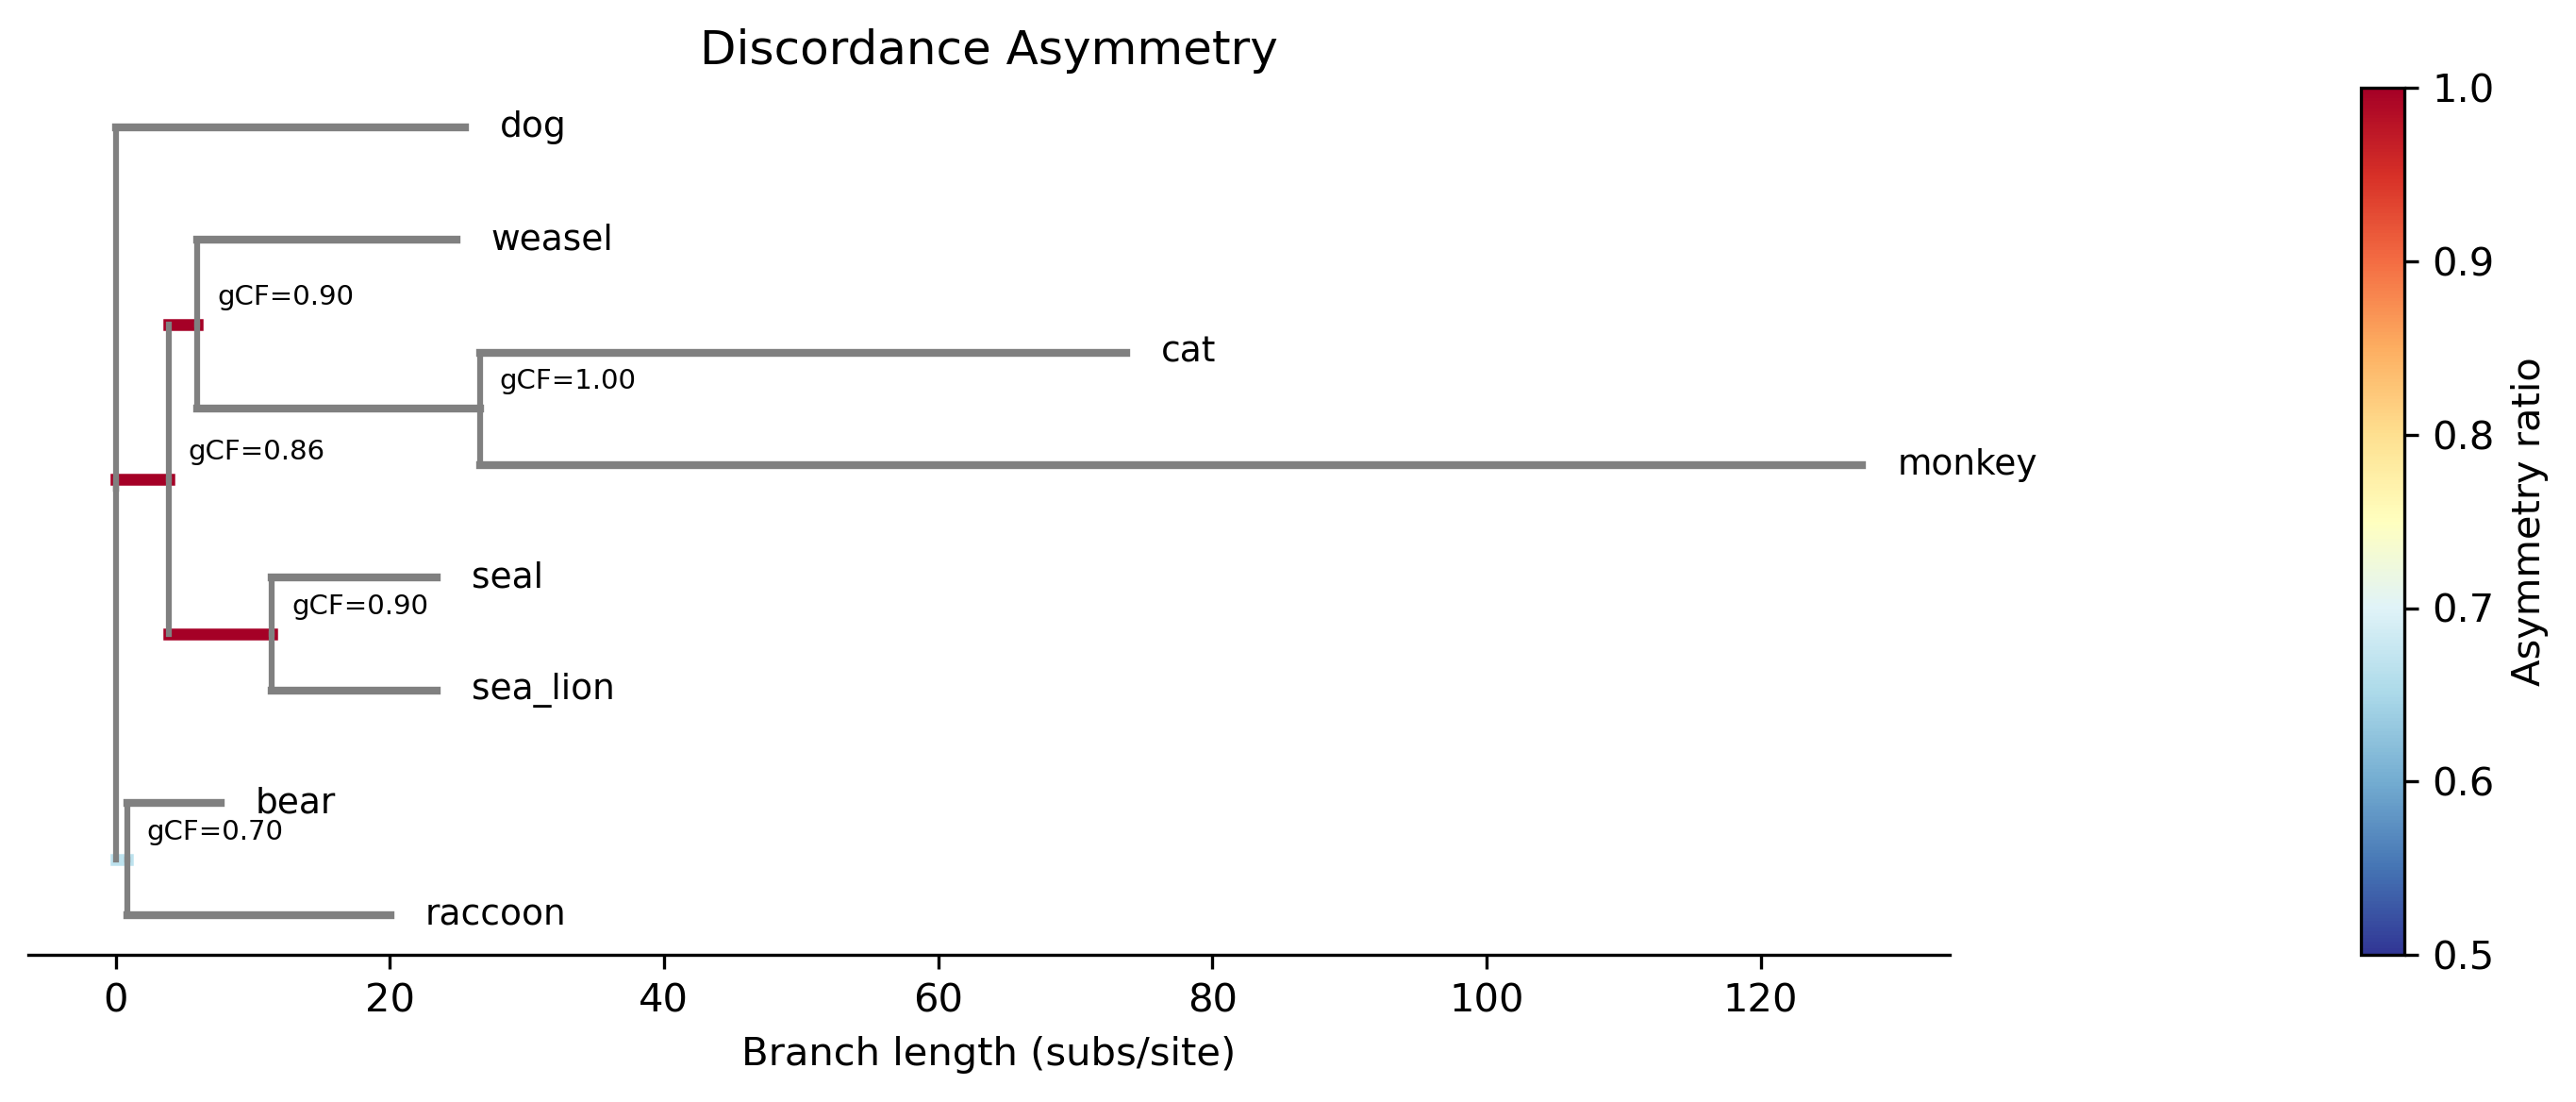
Branches are colored by asymmetry ratio (blue = symmetric, red = asymmetric). All branches are blue here, confirming symmetric discordance consistent with ILS. In datasets with introgression, branches near hybridization events would appear red with significant p-values.
Step 4: Identify diversification patterns with LTT
Before diving into trait analyses, examine the tempo of diversification. For a suspected rapid radiation, the lineage-through-time (LTT) plot can confirm whether most speciation events were clustered early in the clade's history — which would also explain the high gene tree conflict observed in Step 1 (short internodes produce more ILS).
phykit ltt -t <your_rooted_tree.nwk> --plot-output ltt_plot.png
Note: the ltt command requires a rooted, fully bifurcating tree.
The sample tree used in this tutorial has a trifurcation at the root,
so substitute your own rooted tree for this step.
The gamma statistic tests whether branching events are uniformly distributed over time (null: constant-rate pure-birth). A significantly negative gamma would confirm a rapid-radiation hypothesis — most lineages originated in a short burst, leaving little time for gene tree coalescence and producing the discordance observed in the splits network.
Step 5: Concordance-aware ancestral state reconstruction
Standard ASR operates on a single species tree, ignoring gene tree
conflict. For our clade, the ancestral thermal tolerance at the base of
the radiation is of particular interest — but if 40% of gene trees
disagree about which species are sisters at that node, the standard
ASR estimate may be overconfident. PhyKIT's concordance_asr
propagates topological uncertainty from gene tree discordance into
ancestral state estimates.
phykit concordance_asr -t tree_simple.tre -g gene_trees_simple.nwk -d tree_simple_traits.tsv
Expected output:
Concordance-Aware Ancestral State Reconstruction

Method: weighted
Number of tips: 8
Number of gene trees: 10
Sigma-squared (BM rate): 0.043893

Ancestral estimates:
  Node          Desc    Estimate     gCF    Var_topo   Var_param
  N1 (root)        8      1.6447   1.000    0.000000    0.146822
  N2               2      1.6881   0.700    0.000569    0.140151
  N3               5      1.4878   0.857    0.005878    0.167045
  N4               2      1.7682   0.900    0.015002    0.181806
  N5               3      1.2674   0.900    0.001044    0.210295
  N6               2      0.9895   1.000    0.000000    0.629294
The gCF column shows the gene concordance factor — the fraction of
gene trees that agree with the species tree at each node. Node N2 (gCF
= 0.70) has the most discordance: only 7 of 10 gene trees support this
bipartition. The Var_topo column captures the additional variance
introduced by topological uncertainty. Compare N2 (Var_topo = 0.0006)
to the root N1 (Var_topo = 0.0000, since the root is shared by all
trees). Nodes with higher Var_topo have less certain ancestral estimates.
To visualize the reconstruction on the tree:
phykit concordance_asr -t tree_simple.tre -g gene_trees_simple.nwk \
    -d tree_simple_traits.tsv --plot asr_discordance.png
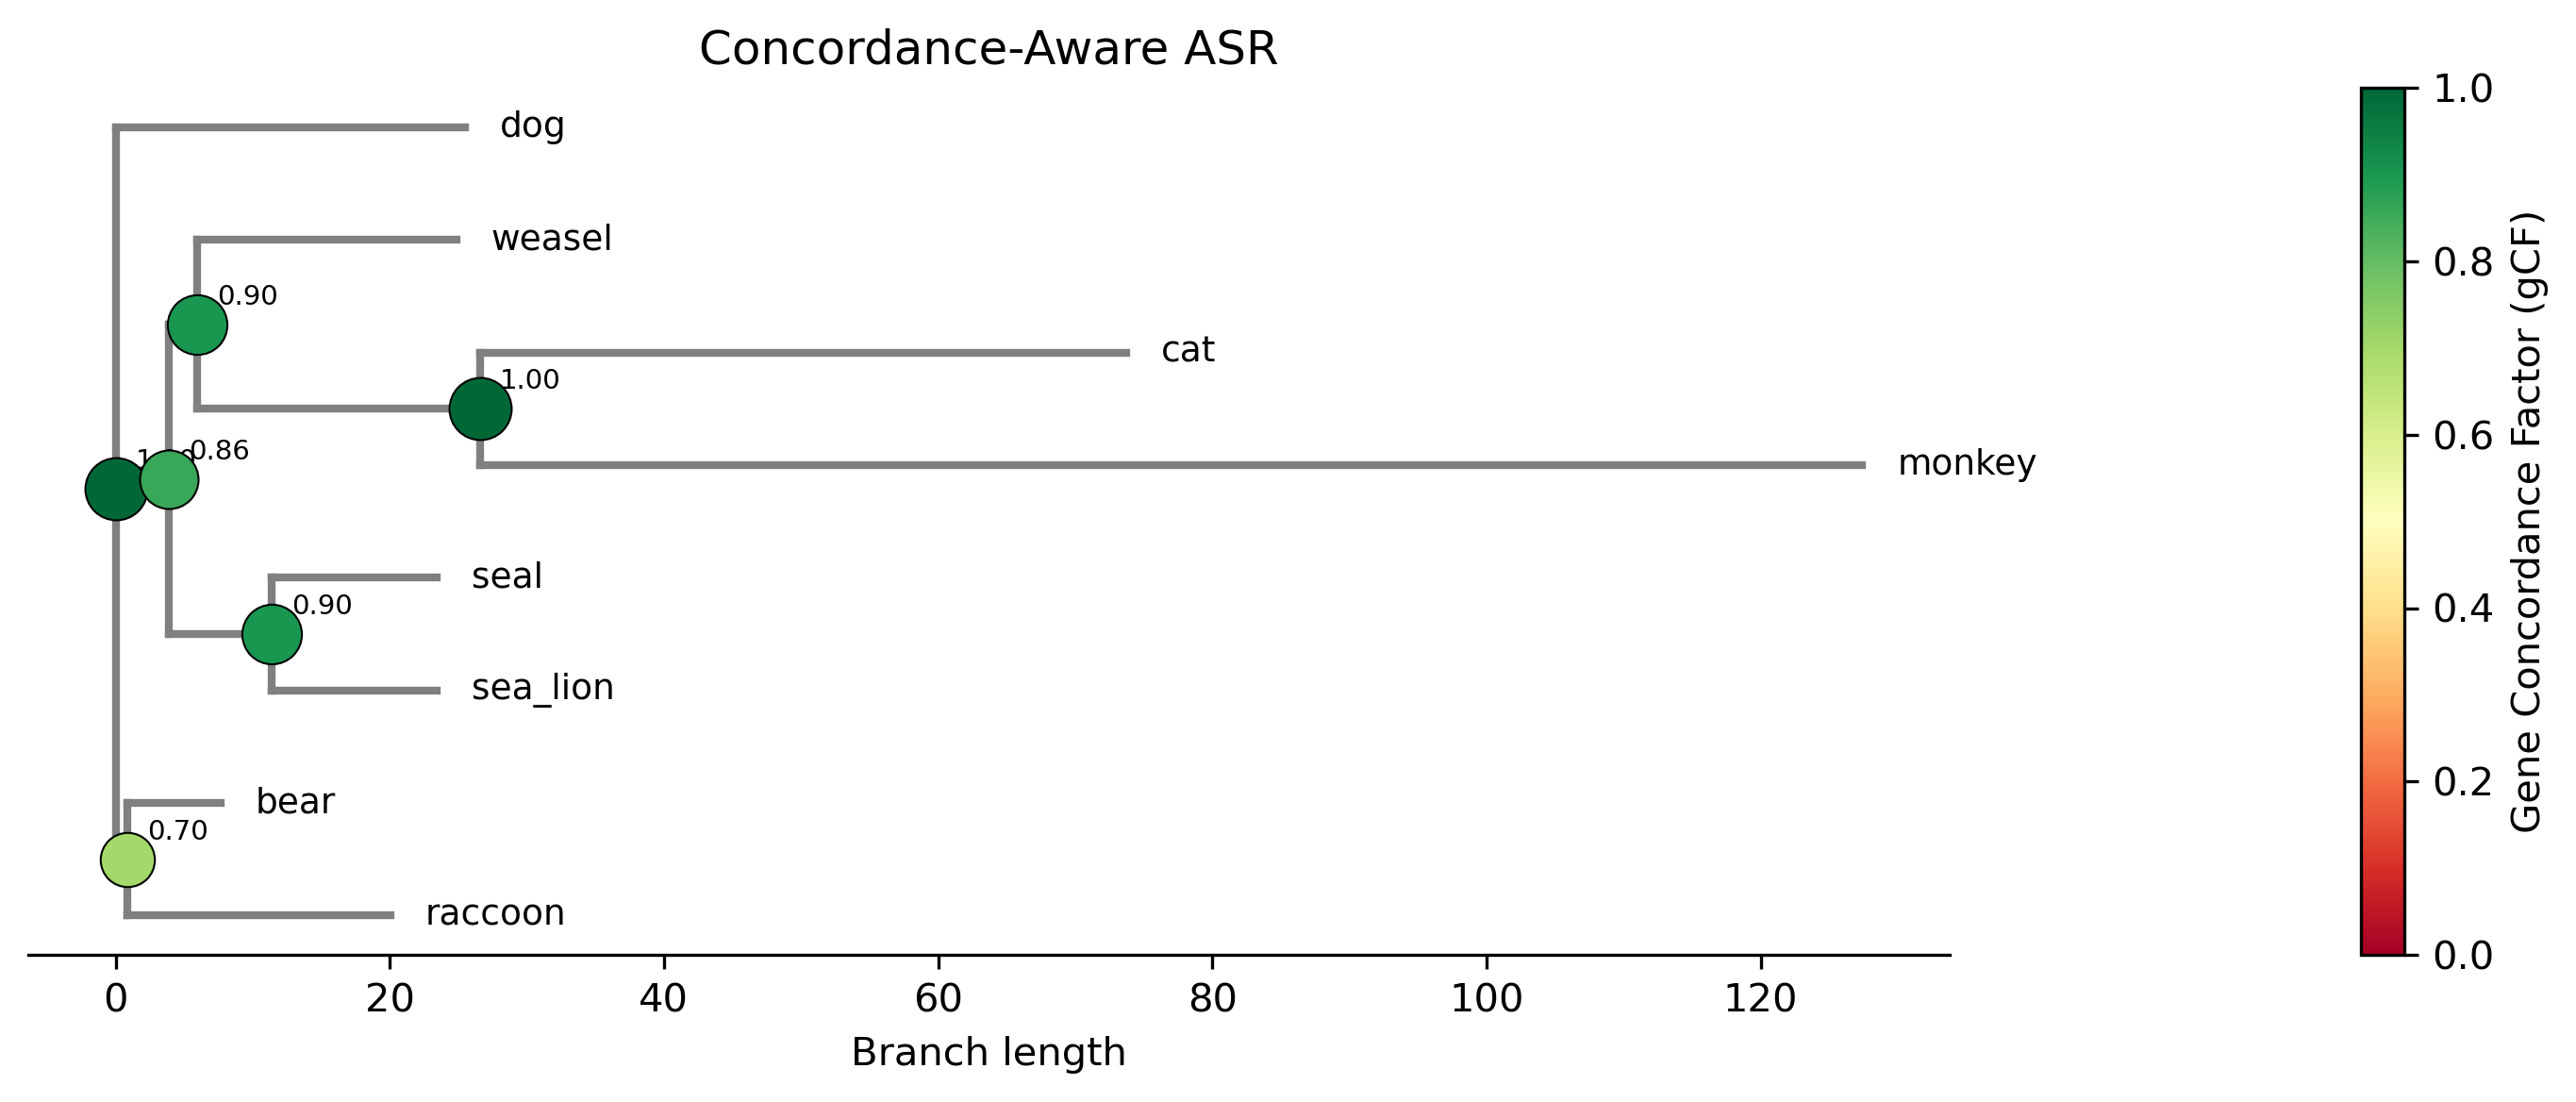
The plot shows the species tree with ancestral values painted along branches, similar to a contMap, but incorporating the concordance-weighted estimates at each node. Nodes with low gCF values have more uncertain reconstructions.
For distribution-based reconstruction and confidence intervals:
phykit concordance_asr -t tree_simple.tre -g gene_trees_simple.nwk \
    -d tree_simple_traits.tsv -m distribution --ci --json
Step 6: Discordance-aware comparative methods
Now we return to our original question: does thermal tolerance predict metabolic rate? In a clade with substantial gene tree conflict, the species tree alone may not accurately represent how species are related across the genome. Two species that are sisters in the species tree but have discordant histories at many loci share less evolutionary history than the species tree implies. PhyKIT addresses this by computing a variance-covariance (VCV) matrix from each gene tree and averaging them, producing a genome-wide covariance structure that better reflects the true shared history.
Phylogenetic signal with discordance-aware VCV:
phykit phylogenetic_signal -t tree_simple.tre -d tree_simple_traits.tsv \
    -g gene_trees_simple.nwk --json
{"K": 0.5819, "p_value": 0.479, "permutations": 1000,
 "r_squared_phylo": 0.9511,
 "vcv_metadata": {"n_gene_trees": 10, "n_shared_taxa": 8,
                  "psd_corrected": false}}
Compare these results to the species-tree-only analysis in tutorial 18 (K = 0.5842, R²_phylo = 0.9499). The discordance-aware values are very similar here because most gene trees are concordant with the species tree. In datasets with more discordance, the differences would be larger.
The vcv_metadata field in the JSON output reports how many gene trees
contributed to the averaged VCV and whether a positive-semidefinite
correction was needed.
PGLS with discordance-aware VCV:
phykit pgls -t tree_simple.tre -d tree_simple_multi_traits.tsv \
    -y brain_size -x body_mass -g gene_trees_simple.nwk --json
The discordance-aware PGLS produces nearly identical results for this dataset (R² = 0.9749 vs. 0.9763 without gene trees), confirming that the brain-body allometry is robust to gene tree conflict. In datasets with substantial discordance, you may see changes in slope, standard errors, and p-values.
Model comparison with discordance-aware VCV:
phykit fit_continuous -t tree_simple.tre -d tree_simple_traits.tsv \
    -g gene_trees_simple.nwk --json
When the -g/--gene-trees flag is omitted, all commands behave
exactly as before (species-tree-only VCV).
Putting it all together
Returning to our rapid-radiation scenario, the workflow reveals a coherent story:
Quantify conflict (
consensus_network) — the splits network shows that several deep bipartitions are supported by only 40-60% of gene trees, confirming substantial discordance.Rate-topology associations (
evo_tempo_map) — discordant gene trees have shorter internal branches than concordant ones, consistent with the coalescent expectation. No significant rate heterogeneity is detected, suggesting neutral sorting rather than adaptive evolution.Asymmetric discordance (
discordance_asymmetry) — no significant asymmetry detected in any branch, consistent with neutral ILS and no gene flow between the sampled lineages.Examine diversification (
ltt) — a significantly negative gamma statistic confirms that most speciation events were clustered in a short burst, explaining the ILS-driven gene tree conflict.Concordance-aware ASR (
concordance_asr) — ancestral thermal tolerance estimates at the rapid-radiation node have wide confidence intervals, reflecting genuine uncertainty about which species were ancestrally sister to each other.Discordance-aware comparative methods (
pgls,phylogenetic_signal,fit_continuous) — using the genome-wide average VCV produces more conservative (and more accurate) p-values for the thermal tolerance–metabolic rate relationship.
This workflow generalizes to any phylogenomic dataset where gene tree conflict is a concern: substitute your own species tree, gene trees, and trait data. When discordance is minimal, the discordance-aware results will closely match species-tree-only results, confirming that the standard analysis was adequate.
Expected artifacts
Each step identifies its expected terminal output or generated files. Confirm that those artifacts exist before continuing to the next step; filenames are relative to the tutorial working directory unless an absolute path is shown.
Troubleshooting
Run
phykit <command> --helpto compare an invocation with the live interface.Confirm that downloaded files are in the current working directory and retain the filenames shown in the tutorial.
For parsing errors, compare taxon names exactly across alignments, trees, and trait tables, including capitalization and underscores.
See Troubleshooting for installation, format, and error-reporting guidance.