Tutorial 1: Summarizing information content
Objectives
Complete the summarizing information content workflow.
Interpret the reported values and generated artifacts in their scientific context.
Identify the canonical command references for each analysis step.
Prerequisites and working directory
Install the current PhyKIT release and create a dedicated working directory. Download the data linked in this tutorial into that directory before running the commands. All paths below are relative to this directory.
mkdir phykit-tutorial-01
cd phykit-tutorial-01
Workflow
PhyKIT implements numerous functions that can be used to examine the information content and help researchers summarize information content and identify potential biases in multiple sequence alignments and phylogenies.
Among other uses, one use of summarizing information content is to facilitate subsampling larger phylogenomic data matrices to further explore tree space during species-level tree inference or for divergence time estimation. (Salichos and Rokas 2013; Liu et al. 2017; Smith et al. 2018; Shen et al. 2018 & 2020; Steenwyk et al. 2019; Walker et al. 2019; Li et al. 2020)
The information content summarized in the remainder of this section is associated with strong phylogenetic signal (or robust and accurate tree inference). When subsampling genes, a researcher could take a fraction of the best scoring phylogenies to reinfer species-level relationships or divergence times (e.g., robustly supported phylogenies and genes that do not violate clock-like patterns of evolution).
For example, in Steenwyk et al. 2019, we subsampled the complete phylogenomic data matrix for 50% of genes that had the best score for various matrices. Using the subsampled matrices, we reinferred species trees and compared the topologies across all species-level phylogenies. Bipartitions that were not recovered in all analyses were considered unstable. The following figure depicts the general pipeline we used (note, some of the metrics have been modified following newer insights).
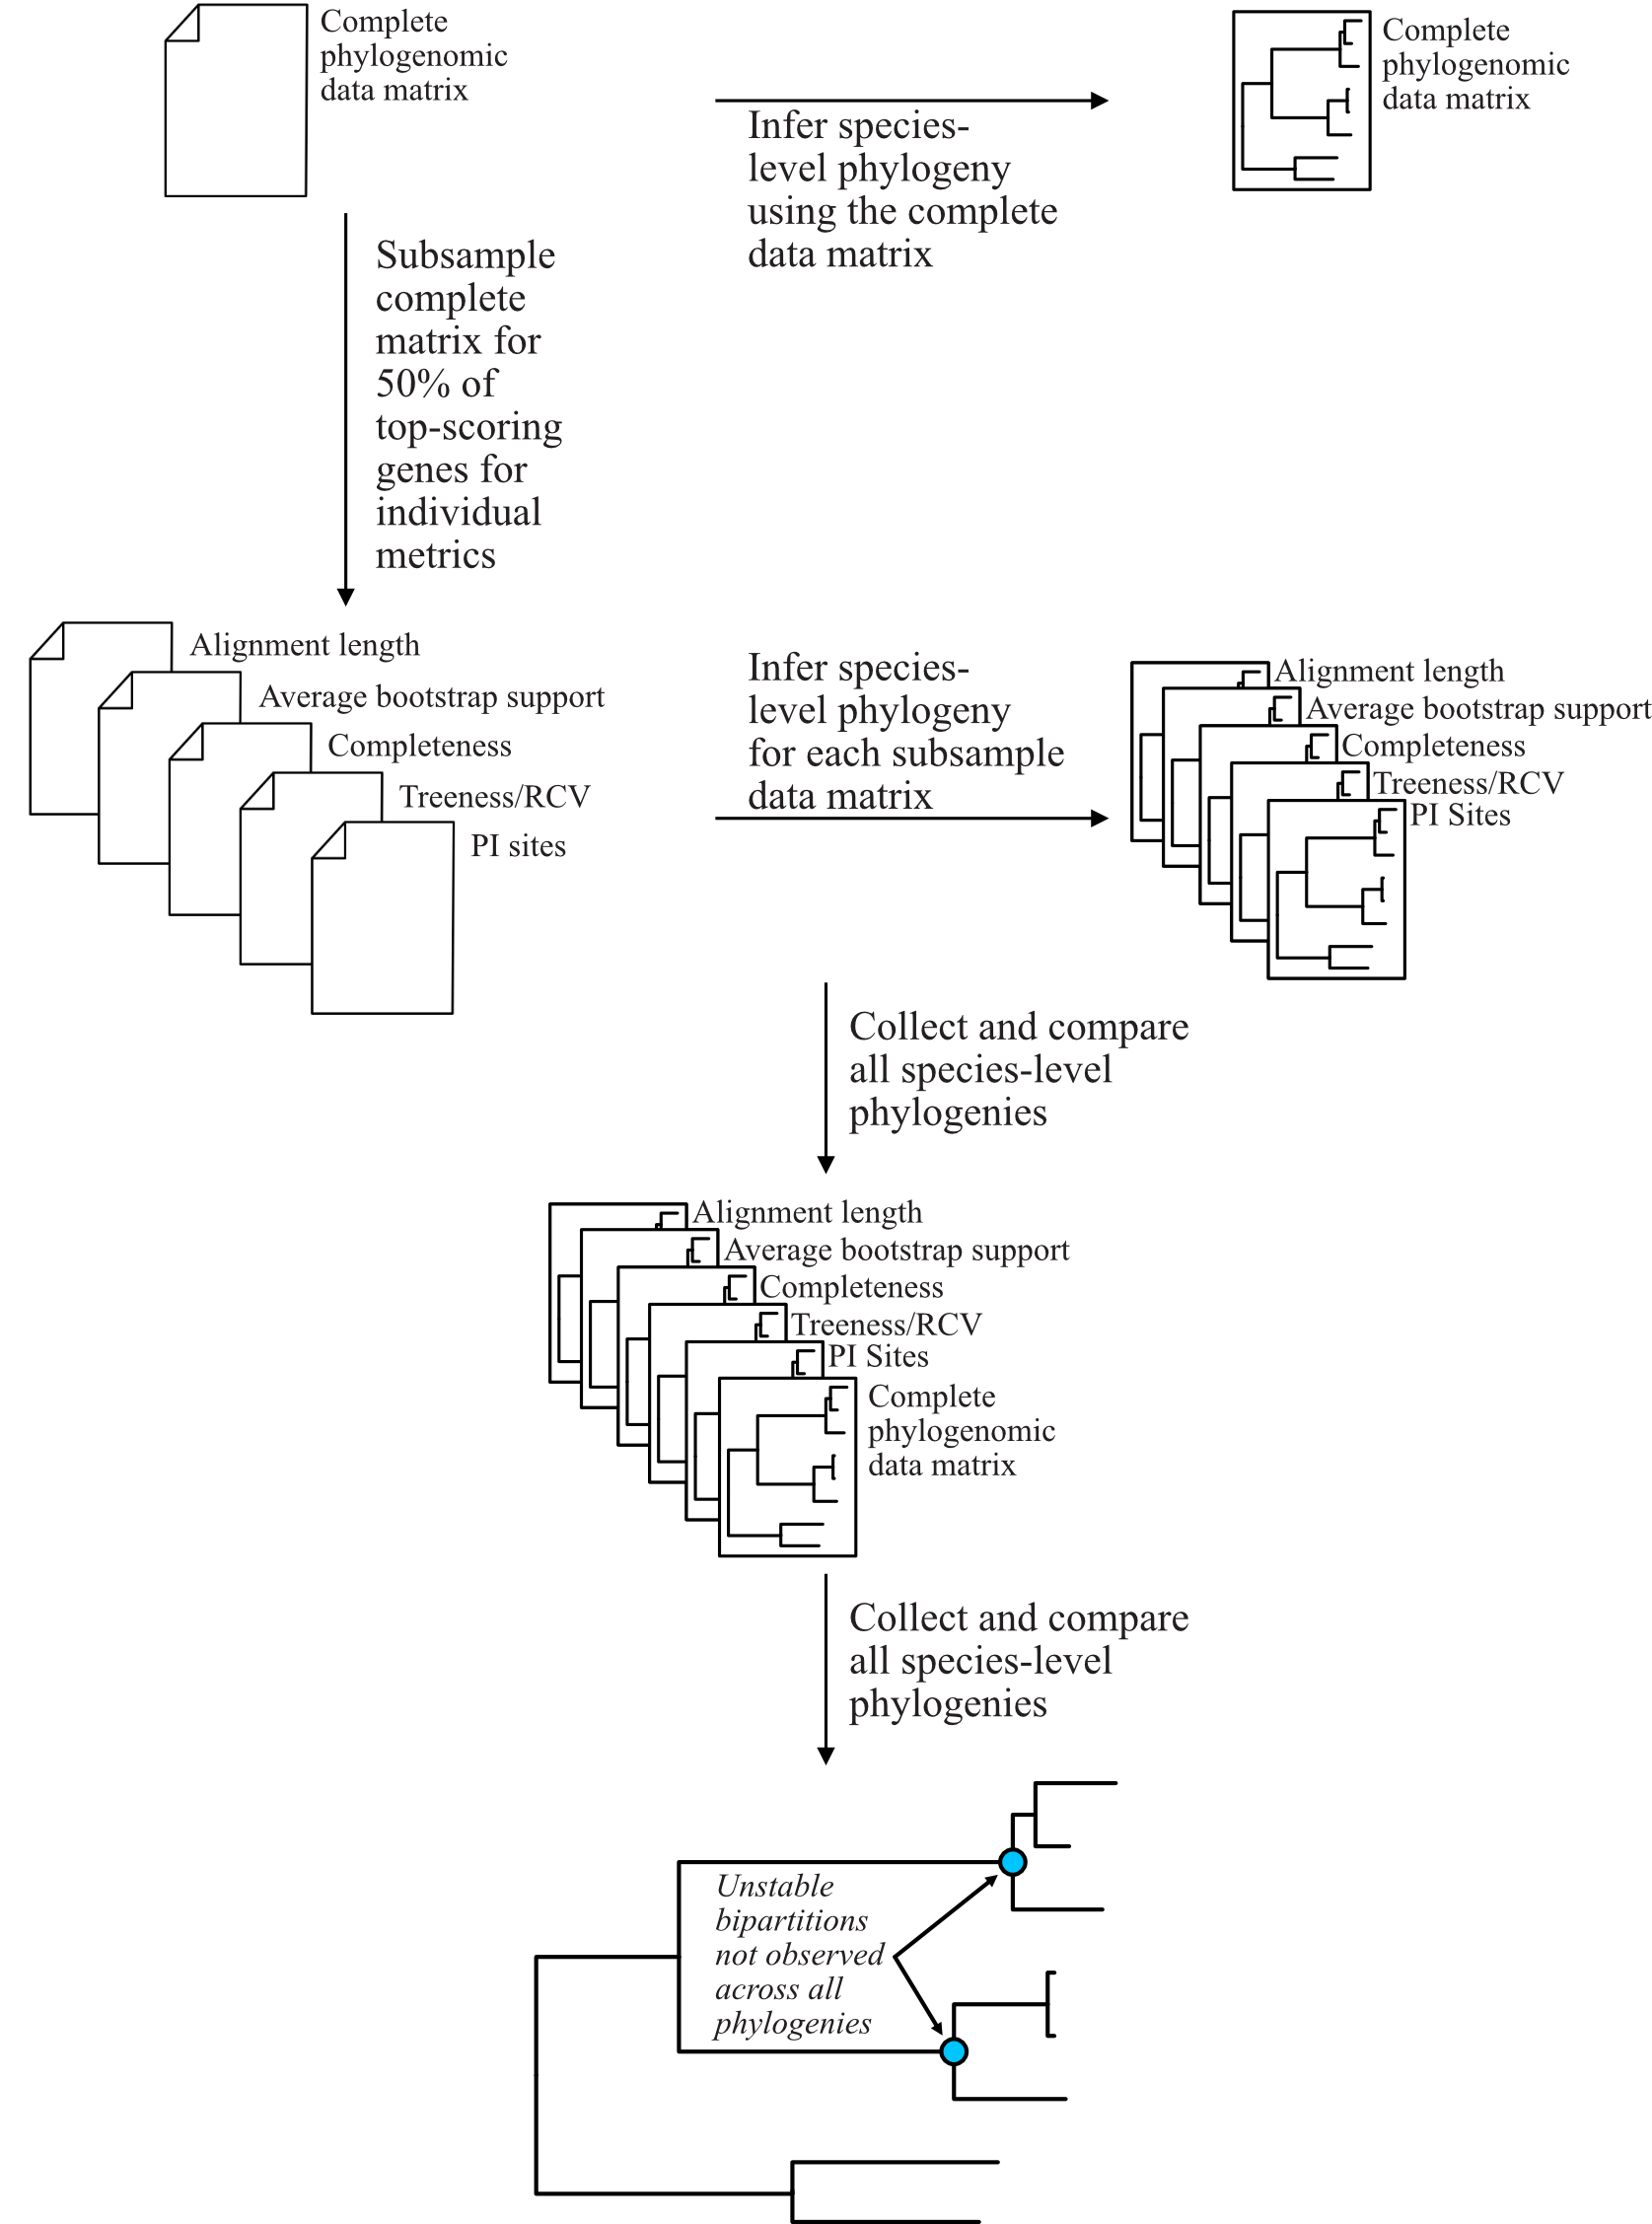
In this tutorial, we will use the following test multiple sequence alignment and phylogenetic tree, which came
from Steenwyk et al. 2019.
Download test data:
Multiple sequence alignment;
Single-gene phylogeny
Alignment length
Alignment length and the length of an alignment excluding sites with gaps are associated with robust and accurate tree inferences (Shen et al. 2016). Calculate alignment length with the following command:
phykit aln_len Steenwyk_etal_mBio_2019_EOG091N44MS.aln.fa
624
To exclude alignment gaps, use the following option:
phykit aln_len_no_gaps Steenwyk_etal_mBio_2019_EOG091N44MS.aln.fa
321 624 51.4423
col1: number of sites without gaps
col2: total number of sites
col3: percentage of sites without gaps
Bipartition support statistics
High average bipartition support in a phylogeny is associated with robust phylogenetic inference (Salichos and Rokas 2013; Shen et al. 2016). Thus, genes with high bipartition support values have greater certainty among bipartitions. Calculate bipartition support summary statistics with the following command:
phykit bss Steenwyk_etal_mBio_2019_EOG091N44MS.tre
mean: 88.6437
median: 99
25th percentile: 83.0
75th percentile: 100.0
minimum: 28
maximum: 100
standard deviation: 18.5504
variance: 344.1157
Long branch score
Long branch scores (or LB scores) help determine taxa that may be contributing to long-branch problems (Struck 2014). Similarly, the standard deviation of LB scores among taxa can be used as a measure of heterogeneity. To calculate summary statistics of LB scores for all taxa in a given phylogeny, use the following command:
phykit lb_score Steenwyk_etal_mBio_2019_EOG091N44MS.tre
mean: -1.1111
median: -14.4566
25th percentile: -17.8686
75th percentile: -3.4048
minimum: -23.7982
maximum: 211.1845
standard deviation: 39.1931
variance: 1536.0987
LB scores of individual taxa are also informative for diagnosing taxa driving long-branch problems. The lower the values, the less susceptible the taxon is to long-branch problems. To get the LB score of each taxon, use the verbose option:
phykit lb_score Steenwyk_etal_mBio_2019_EOG091N44MS.tre --verbose
Aspergillus_aculeatus   -13.7403
Aspergillus_arachidicola        -15.382
Aspergillus_parasiticus -15.2214
Aspergillus_sojae       -15.2627
Aspergillus_flavus      -14.7755
Aspergillus_oryzae      -14.7755
Aspergillus_bombycis    -11.1987
...                     ...
Parsimony informative sites
The number of parsimony informative sites in an alignment is associated with strong phylogenetic signal. (Shen et al. 2016; Steenwyk et al. 2020). Calculate the number of parsimony informative sites in an alignment with the following command:
phykit pis Steenwyk_etal_mBio_2019_EOG091N44MS.aln.fa
517 624 82.8526
col1: number of parsimony informative sites
col2: total number of sites
col3: percentage of parsimony informative sites
Saturation
Saturation in a multiple sequence alignment is driven by sites with multiple substitutions and results in the alignment underestimating real genetic distances among taxa. Values of 1 have no saturation and values of 0 are completely saturated by multiple substitutions (Philippe et al. 2011). Estimate saturation with the following command:
phykit sat -a Steenwyk_etal_mBio_2019_EOG091N44MS.aln.fa -t Steenwyk_etal_mBio_2019_EOG091N44MS.tre
0.3017 0.6983
Treeness divided by relative composition variability
Treeness divided by relative composition variability (treeness/RCV) is associated with strong phylogenetic signal. Higher treeness and lower RCV values are indicative of a lower potential for bias (composition-based or otherwise) and a lower degree of composition bias. Thus, higher treeness/RCV values are indicative of genes less susceptible to composition and other biases. (Lanyon 1988; Phillips and Penny 2003; Shen et al. 2016). Calculate treeness/RCV using the following command:
phykit toverr -a Steenwyk_etal_mBio_2019_EOG091N44MS.aln.fa -t Steenwyk_etal_mBio_2019_EOG091N44MS.tre
5.0727 0.5136 0.1013
col1: treeness/RCV
col2: treeness
col3: RCV
To individually calculate treeness, a measure of signal-to-noise among branch lengths (Lanyon 1988; Phillips and Penny 2003), and RCV, a measure of composition bias (Phillips and Penny 2003), use the following commands:
# calculate treeness
phykit tness Steenwyk_etal_mBio_2019_EOG091N44MS.tre

# calculate RCV
phykit rcv Steenwyk_etal_mBio_2019_EOG091N44MS.aln.fa
0.5136
0.1013
Variable sites
The number of variable sites in an alignment is associated with strong phylogenetic signal. (Shen et al. 2016). Calculate the number of variable sites with the following command:
phykit vs Steenwyk_etal_mBio_2019_EOG091N44MS.aln.fa
555 624 88.9423
col1: number of variable sites
col2: total number of sites
col3: percentage of variable sites
Expected artifacts
Each step identifies its expected terminal output or generated files. Confirm that those artifacts exist before continuing to the next step; filenames are relative to the tutorial working directory unless an absolute path is shown.
Troubleshooting
Run
phykit <command> --helpto compare an invocation with the live interface.Confirm that downloaded files are in the current working directory and retain the filenames shown in the tutorial.
For parsing errors, compare taxon names exactly across alignments, trees, and trait tables, including capitalization and underscores.
See Troubleshooting for installation, format, and error-reporting guidance.